Bullish on Excel
Author: James Brand
Date: 2026-05-26
TL;DR I built a prototype Excel-based DS agent: a narrow UI for running statistics and other analysis on large databases.
Note: I work at MSFT but have nothing to do with Excel; this is just a random guy’s side project.
What Excel gets right
I’m continuing to figure out how AI can help me improve DS workflows, and the latest idea that has been stuck in my mind is that there is a SQL + Excel + R workflow that gets close to the type of structure for human-AI collaboration that I mentioned I want in my last post. In short, I’m looking for tools that force me to focus on a small number of tasks at a time and tighten the loop between AI and human work.
I end up using Excel a lot these days, simply because that’s how data and analyses are often shared with me. I’ve grown to like a lot about it: great raw data visibility and easy collaboration, especially when data is sensitive. Although there are lots of options for data scientists to inspect their data, there’s something nice about having the data be so central to the experience in Excel. The biggest downside is that it makes doing complicated data manipulations (and statistics) quite painful, at least for someone trying to do much data “science”.
Now, Excel Copilot is increasingly strong at building complex spreadsheets, so Excel is not totally limited in this way anymore. But I think what I’ve found myself craving is an agent that can do less, in the sense that it’s constrained to use only a small number of tools – ones that I understand well – and to turn around narrower results quickly, making inspection and iteration easier. In other words, I want less of an agent that goes off and thinks for 10 minutes, and more one that, while saving me from having to know API details and SQL minutiae, forces me to stay tightly in the reasoning loop with it.
So the rest of the post is about the prototype I put together toward this end.
SQL as a backend
Next, let me pitch SQL as a fairly generic backend for data analysis. Most of what I’ve seen in SQL is, conceptually, pretty basic: for filtering, joining, aggregating, and summarizing, it’s amazing at what it does. For more complex tasks, it seems under-utilized; the folks I know who think about speeding up statistical analysis have focused on GPUs (e.g., torch/jax), which is great if you’re lucky enough to have GPUs with little else to do. For the rest of us, I think a more reliable path is to plan on pushing computation into databases or other forms of shared (CPU) compute.
The duckreg and dbreg packages, which I post about a lot, show hints of how much more we can get out of SQL now with AI assistance. A lot of statistical estimation boils down to things SQL does really well: sums and averages. These regression packages use specialized tricks like Mundlak and Wong et al, but many of the difficulties moving complex methods into SQL are just the operational headaches of stitching together long, complex queries programmatically. Thankfully, these are made quite easy by LLMs (which are excellent at SQL). Some examples of things I was able to make well-tested prototypes pretty quickly:
mlogit-style estimation of discrete choice models- Frontier difference-in-differences methods
- Propensity score-based estimators (e.g., IPW, matching)
- Simple ML methods
- Trees and forests
- double-ML style partially linear regression (e.g., Python example in duckreg)
For each method I implemented, SQL handles anything that touches an appreciable fraction of a big table and the local machine handles just an optimization loop over aggregations. This set of tools, if fleshed out, would be plenty to handle a lot of common DS/analytics workflows, but there are also a ton more options that SQL can handle. 1
Benchmark examples: SQL can be fast!
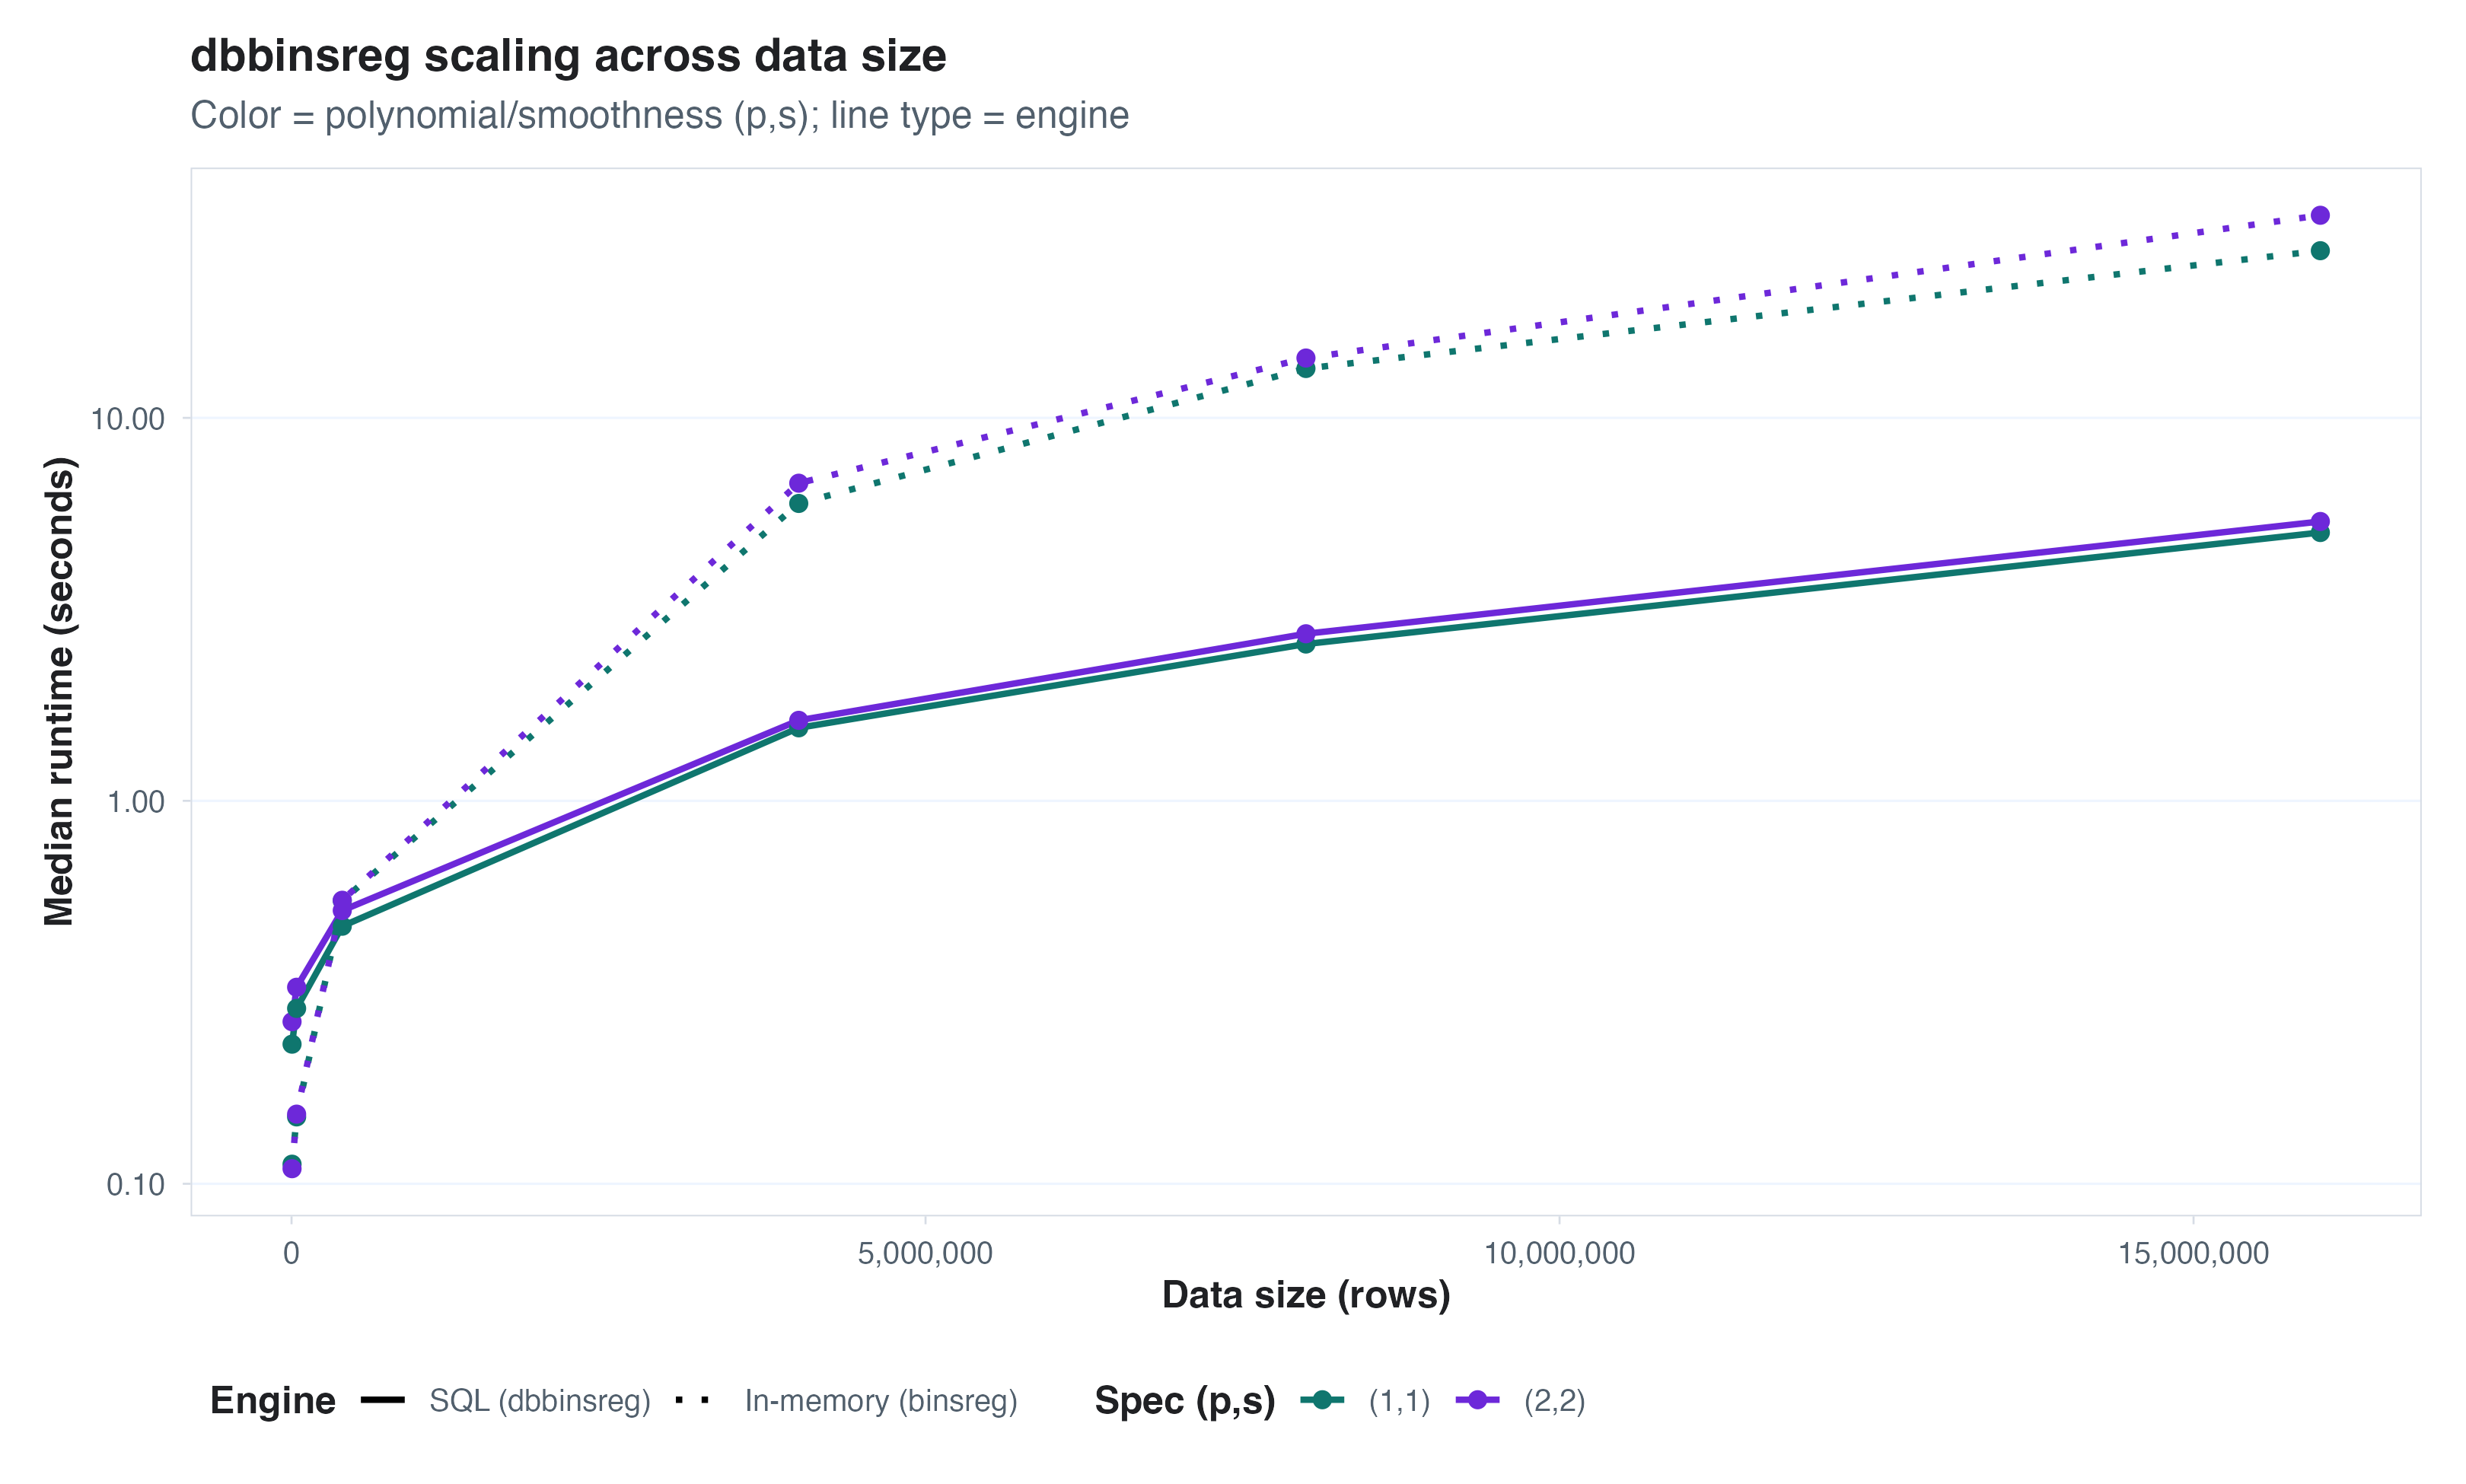
Here are a bunch of timing comparisons between in-memory and SQL-based estimation. The details vary by data, model, and estimator, but the pattern is fairly consistent: once the data is large enough, pushing work to SQL starts to look very attractive. We pretty much always beat the time for keeping large data in memory (on my MacBook Pro) below.
dbbinsreg
I’ve already shown this in a different blog, but for big datasets I
love the functionality of dbbinsreg, a function in
dbreg. I mentioned above that I want to make seeing and
visualizing (large) data easier, and dbbinsreg is a key
step toward that.
Propensity score matching
For propensity scores, I simulated treatment assignment with logit
propensity in three variables. GLMs in continuous variables are
expensive in SQL so I don’t quite beat in-memory IPW, but not far behind
and a nearest-neighbor matching approach scales very nicely. 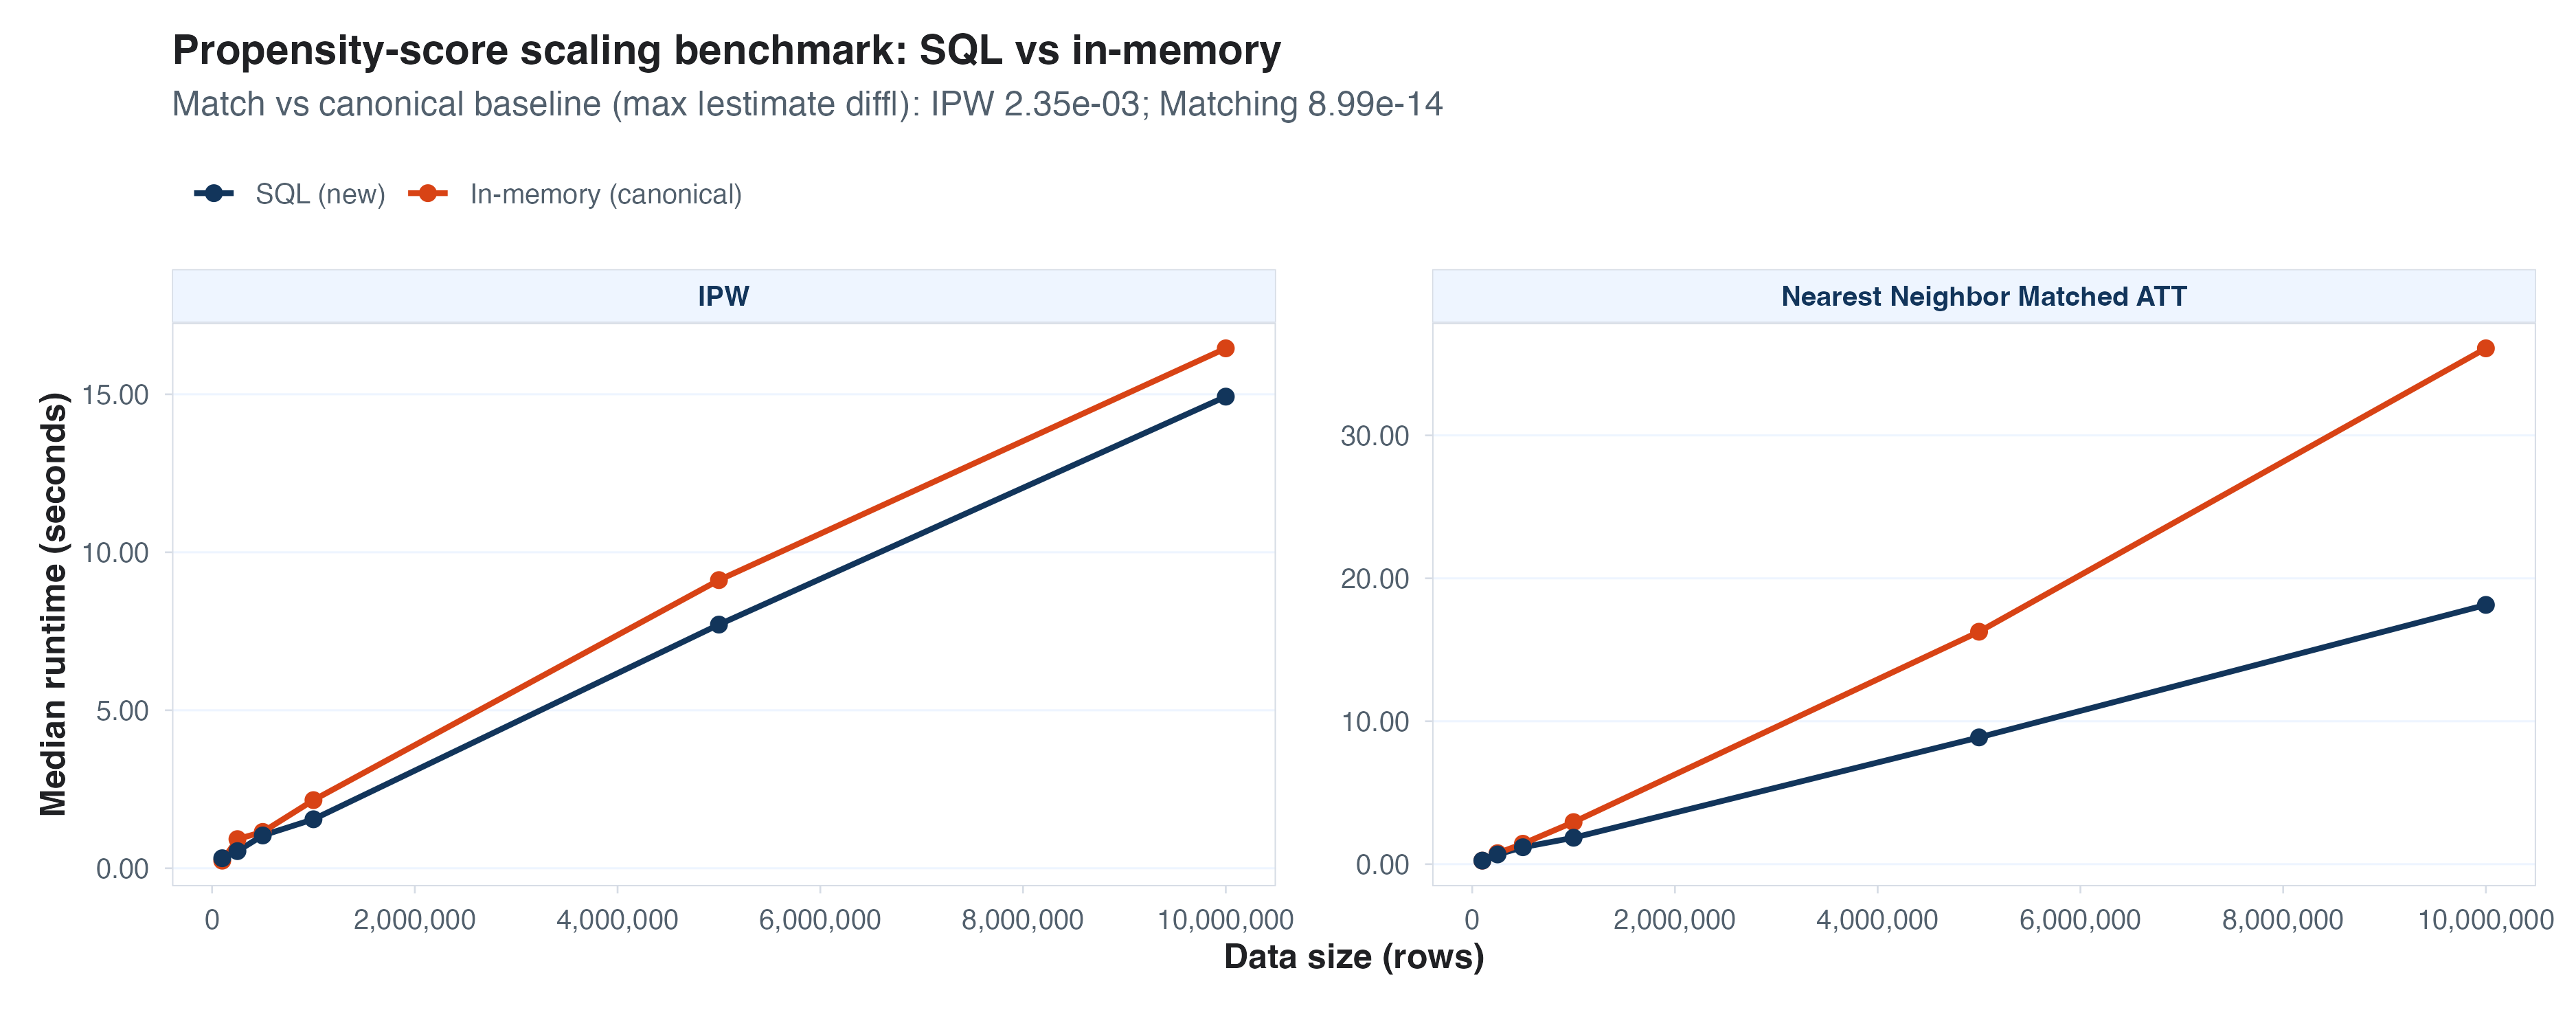
Discrete choice (logit model, 4 alternatives)
Mimicking the mlogit package was the most fun thing I stumbled on in
this prototyping loop, and the SQL version works great. There are some
faster packages for estimating these models, but mlogit is quite
popular. SQL can beat each existing (in-memory) package I’ve tried, for
what it’s worth. 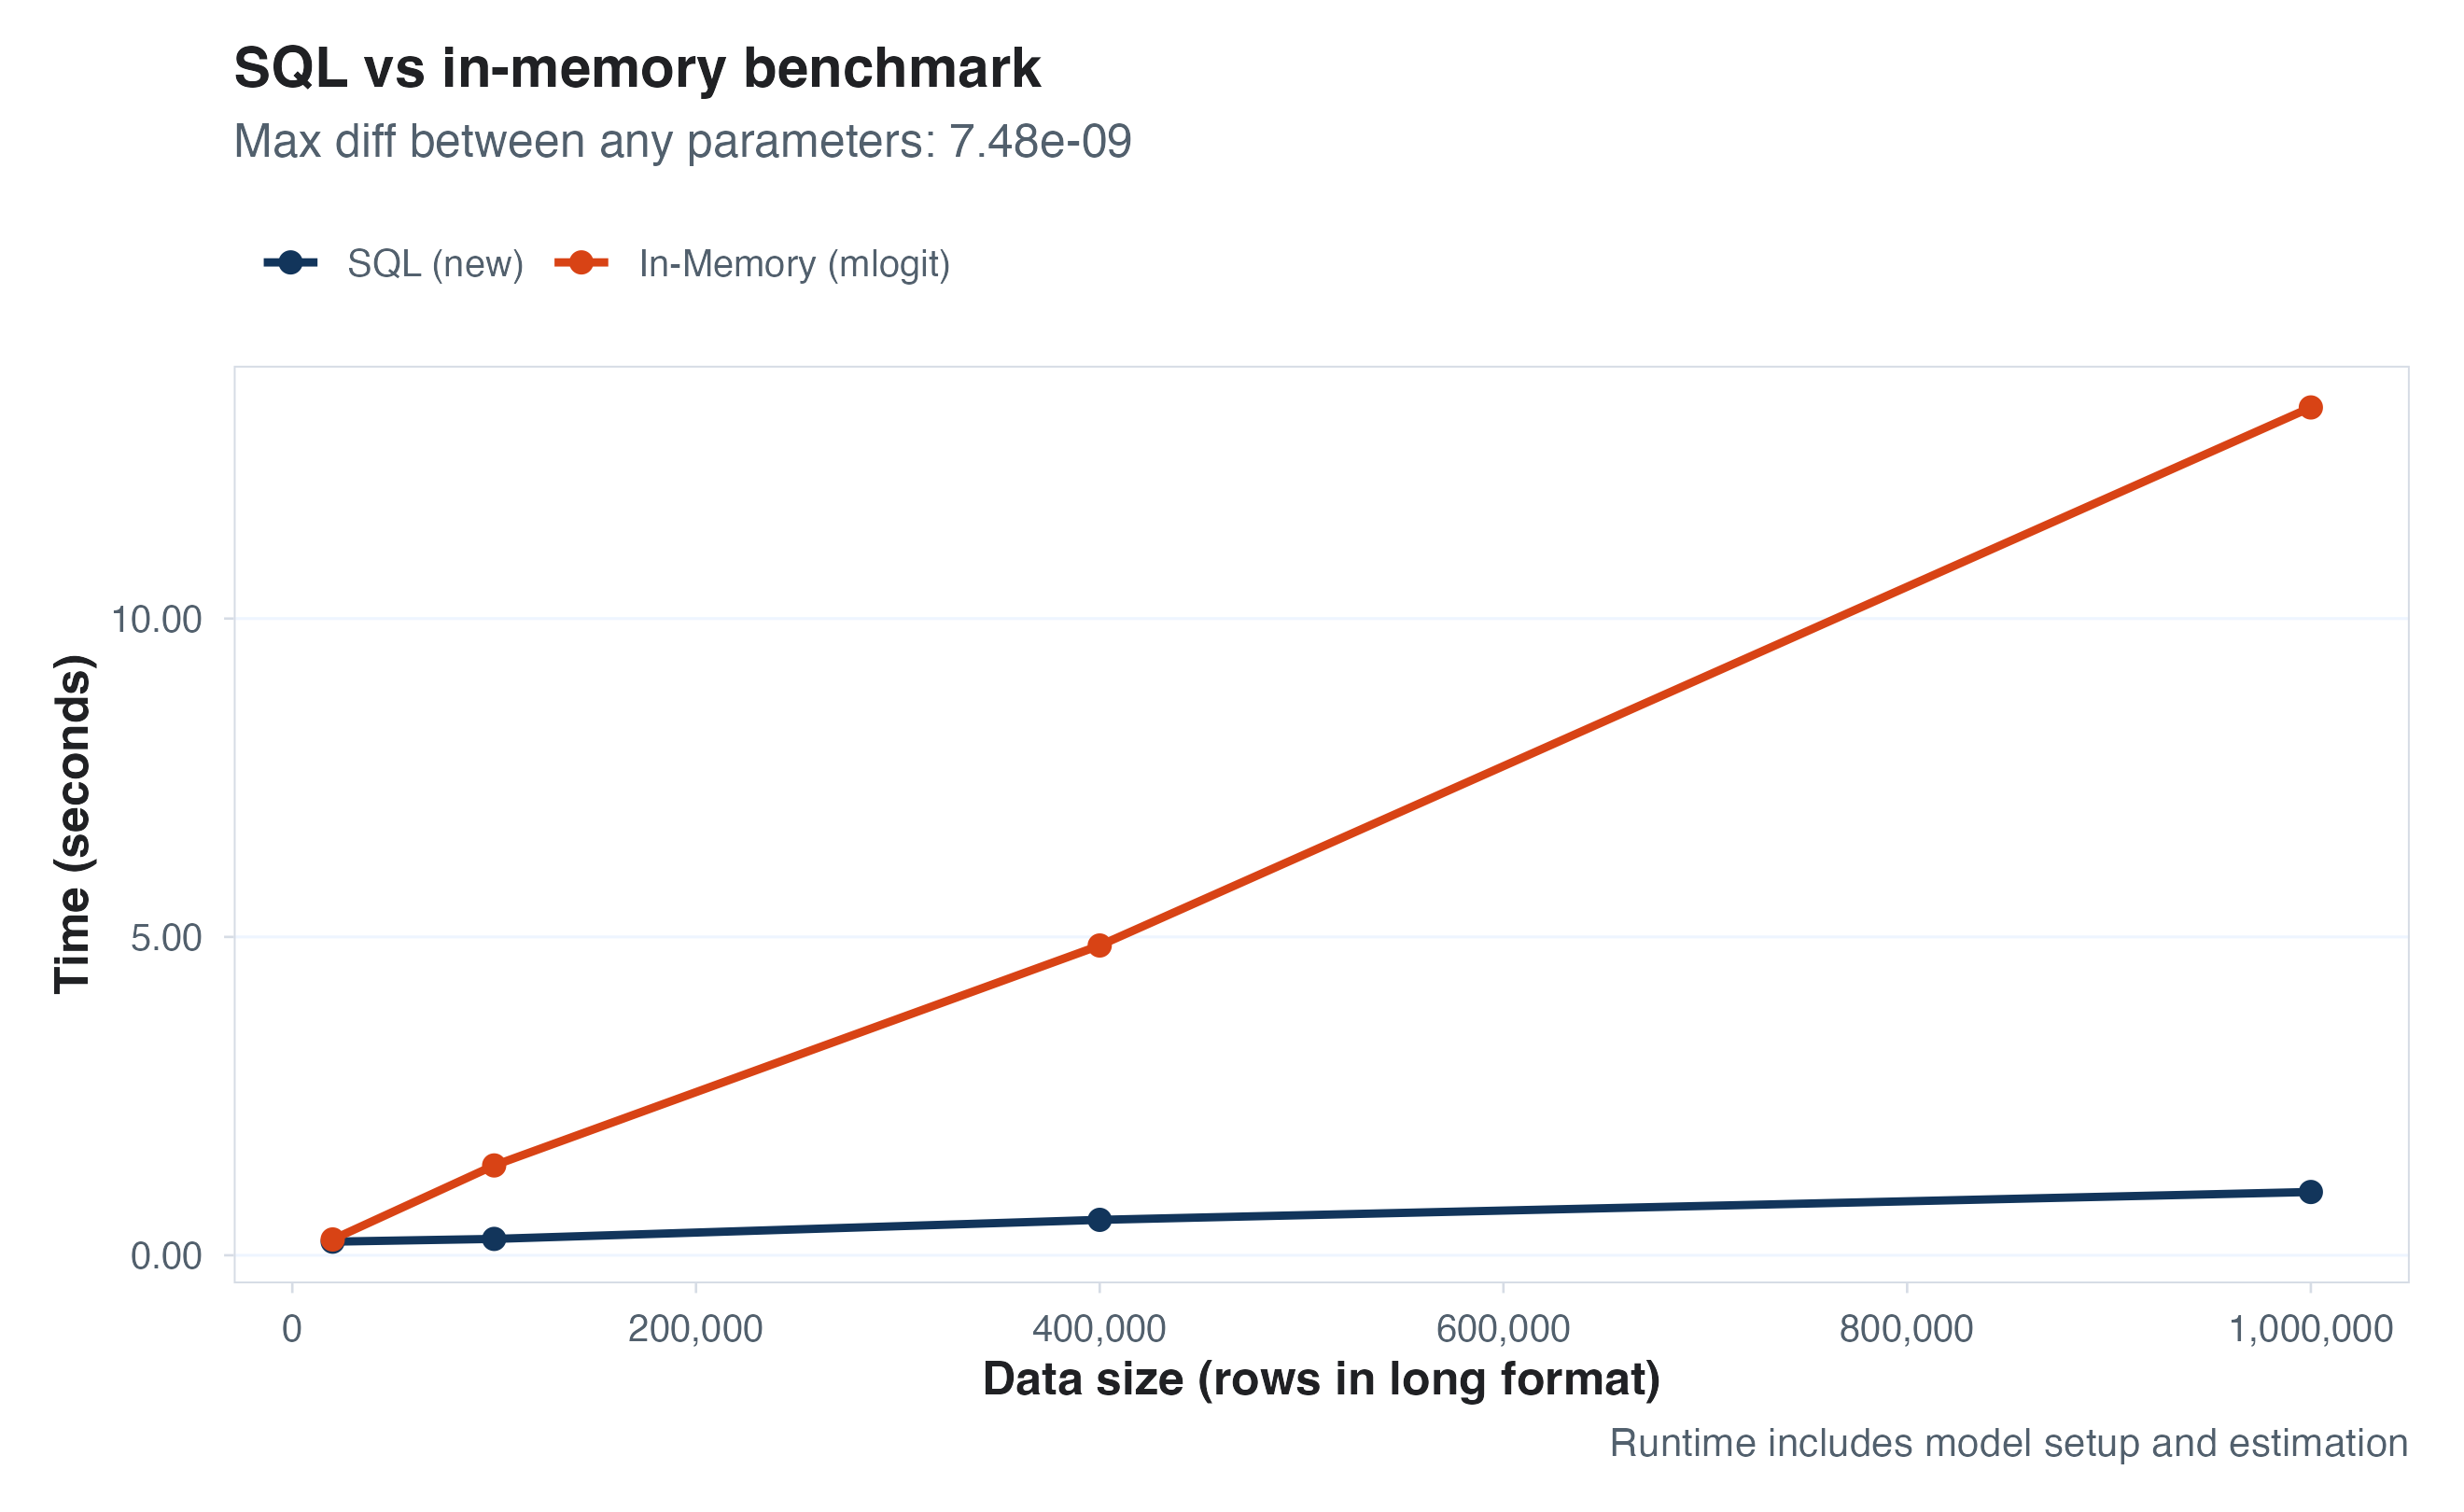
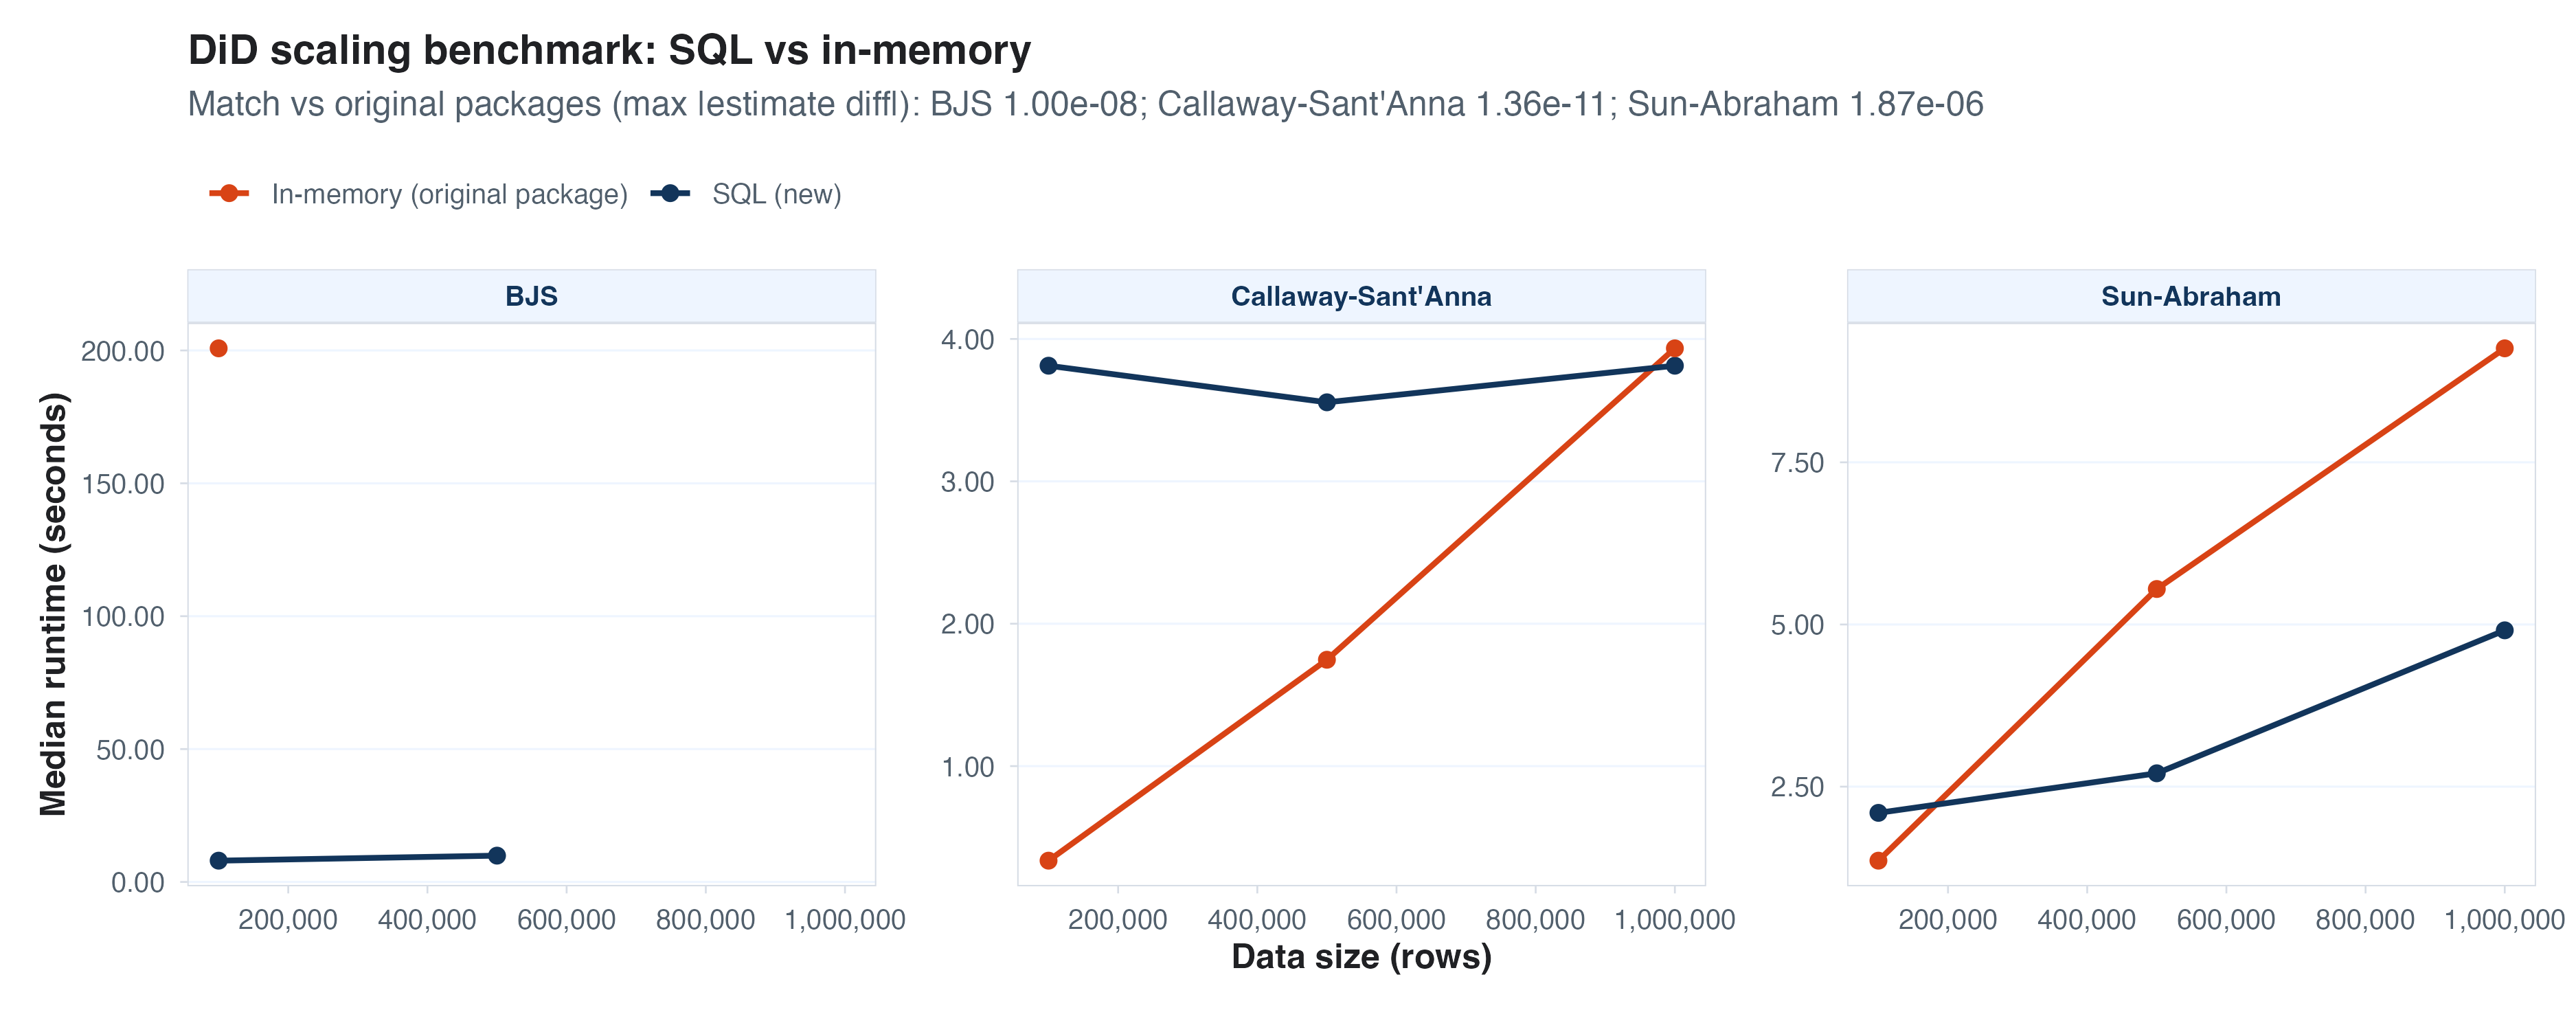
Panel data methods
Finally, building on top of dbreg and adding some custom
additions, we can also implement many of the frontier panel data (e.g.,
difference in differences) methods. Some of these existing packages are
pretty well optimized, but at large enough scale SQL wins again.
The point of all of these examples is that SQL is a great execution layer, even if you (like me) don’t enjoy writing in SQL yourself. We can now treat it as a backend; R/python handles the translation layer and LLMs help with the SQL details, letting the analyst focus on higher-level abstractions and tasks.
Why not HTML/notebooks/code
Now, if I can do all of this via R+SQL, why the mention of a frontend? And why not other tools people use already? A few thoughts:
Let’s meet the masses where they are (and will likely stay) – the majority of people who deal with tabular data probably do so through something like Excel.
Programming languages like R and Python don’t encourage looking at data enough (this is the biggest thing Stata, popular among economists, got right). Excel puts the data right in front of you.
I’ve seen discussions of HTML as the new hot reporting approach; while I’ve done this too (LLMs are great at cooking up quick HTML views), it’s very brittle. Every follow-up question I ask relies on yet another turn with the agent and more HTML, whereas I’d prefer (and I think it’d be better for analysis quality) if I could get some initial results and then dig in and modify them myself.
LLMs are now awesome at writing nice reports straight into Excel, so a lot of what I’d do in HTML is also now doable in Excel.
An Excel agent/copilot frontend for data analysis
Design
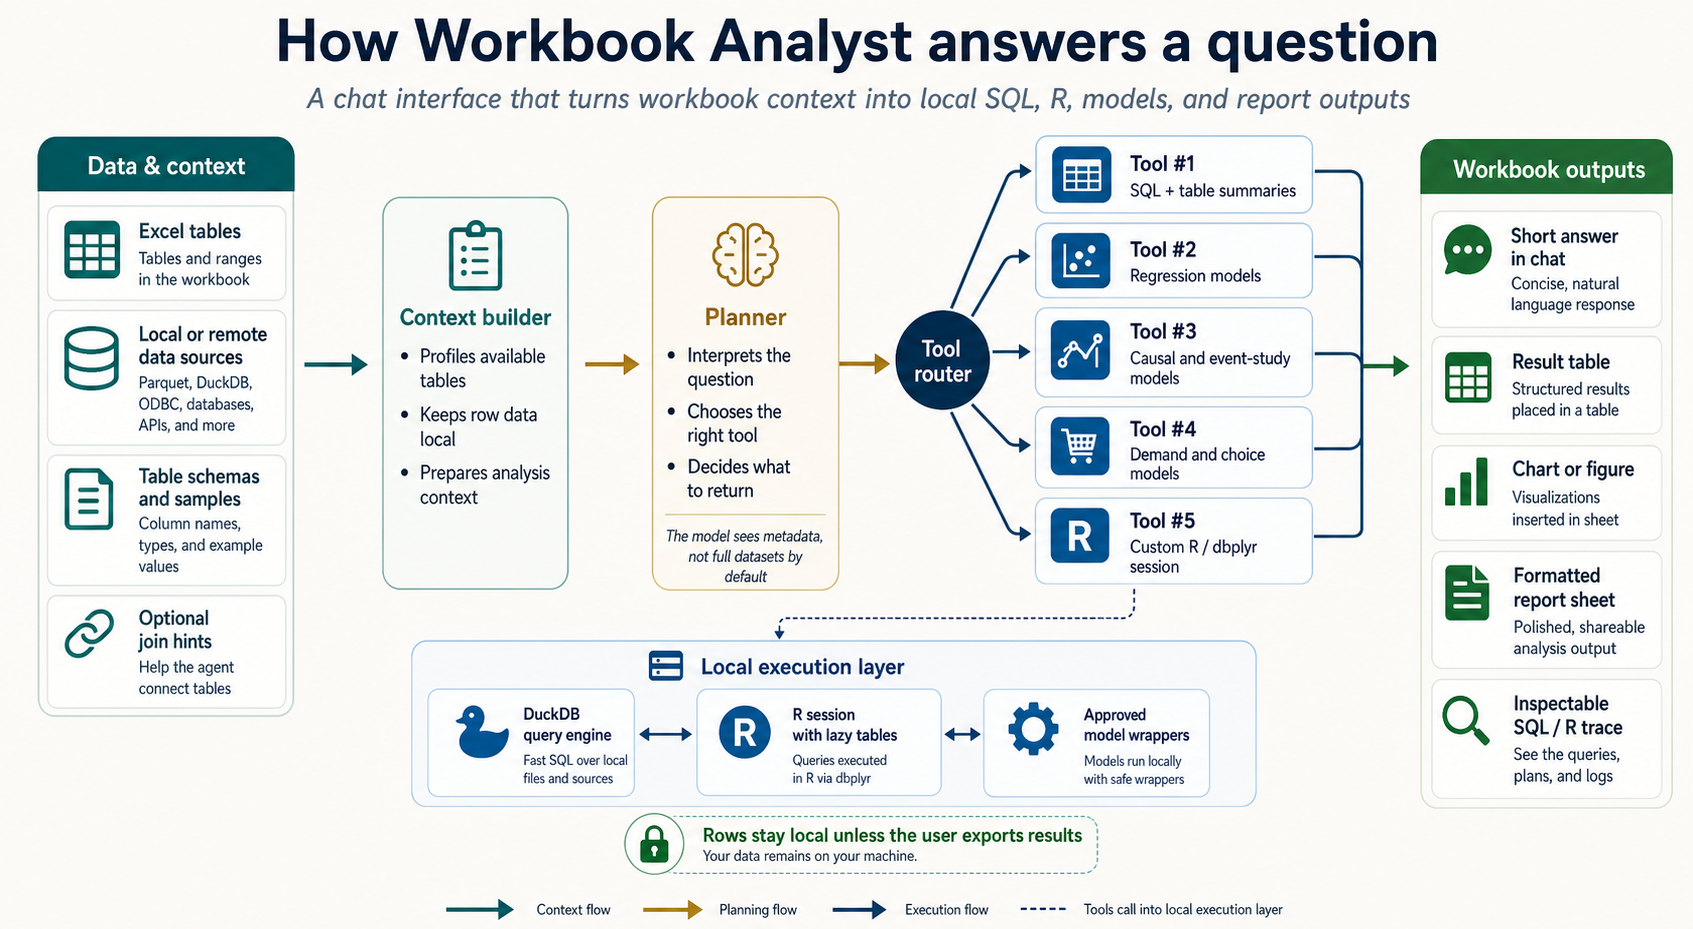
So with the SQL tools built, I then spent time with Codex trying to design, and then build, a prototype for connecting them to data in Excel and letting an LLM access them. Here is a spec image (below) for what resulted. Basically, some deterministic tools read in all available tables in the Excel file and any connected databases, including basic metadata (e.g., schema). A user asks a question, which an LLM converts into a plan using one of few tools provided. There is, by design, little room for improvisation – the LLM has to provide a JSON with tool calls.
The output of those calls gets shown to the LLM so that it’s in context for future turns, and then the user can (a) move any results directly into the worksheet, (b) view the SQL and R code that was run by the tool calls, and (c) extend/modify any of that code and re-run in an R environment that has pre-loaded all available data as lazy tables (meaning they take up no additional memory until commands are executed to collect the data).
Prototype videos
I have never done this before, but to show the final result I had Codex help me make some product demo videos with real examples I’ve tested. The first example basically looks like a trimmed down version of Excel Copilot. We have a table in Excel that we want to study, and the agent has been provided with context and just a few key tools, all based on SQL. It runs a quick analysis, passes the results into an Excel sheet, and then lets the user copy and modify the resulting R code (which is writing SQL under the hood).The second example below is what really excites me. This time, the data we want is way too big for Excel. One table in this example has 178M rows, but (DuckDB) SQL has no problem with that even on my local laptop. We just point our Excel agent at the database, and then it can build the analysis lazily, collect only the end result, and pull that into the sheet for more analysis. The same goes for our discrete choice model tooling above: 8 million rows in a remote database, accessed minimally until results are ready. Then we get the regression coefficients (or choice probabilities or other objects) we asked for.
Last thoughts
One more call-back to my previous blog post about “doing better” with AI. I stand by that, and although the code I’ve produced here works well for me, I don’t intend to post it for a few reasons:
- I don’t have the bandwidth to hold the code to the standard of review I want to hold for public code (though it may well be higher quality than code that I wrote alone before AI!)
- With AI, just this blog post would be enough for anyone somewhat knowledgeable to reproduce a MWE of these things, so you don’t really need my code.
- My prompting to make these tools was not naive and there were plenty of tweaks I made to the early versions. To the extent I came up with anything clever, my incentives to post those ideas/tricks has diminished a lot since they could be easily copied by LLMs, which dilutes the credit that used to come from fun OSS work.
I’m pretty happy with what Codex and I put together here, and I learned a lot through the iteration process. Initially, I built a much smarter LLM harness, but I realized that the smarter I made it, the harder I made it to review the work and output. Dumbing it down fixed that, and I think that if this were a real product I’d get a lot of value out of it. I learned a ton about what I want in data analysis through this process – I hope anyone who made it this far found some value in reading it.