dbbinsreg: summarize big data quickly
Author: James Brand
Date: 2026-01-06
Grant McDermott and I just
made some new additions to the R package dbreg,
which I’ve written about once already here.
Things are getting pretty exciting in that package – once you have a
(reasonably) robust regression tool, there is a lot you can layer on top
of that. Our latest additions now try to mimic a lot of the
functionality of the popular binsreg package. For
those who aren’t familiar, the motivating idea of binsreg
is simply that we often want to visualize the high-level relationship
between fields of the data by binning the data and creating a scatter
plots and/or smooth lines showing various conditional expectations.
Without diving into the details, it turns out that if you want to make
that plot while conditioning on other covariates, including fixed
effects, you have to do so carefully.
binsreg is the cutting edge implementation of this type
of analysis, based on this
paper. The idea is to bin the data and regress one variable on a
flexible piecewise polynomial in the other, along with whatever controls
you want to condition on. Their package gives users options to control
the flexibility of that polynomial and how continuous/smooth it is
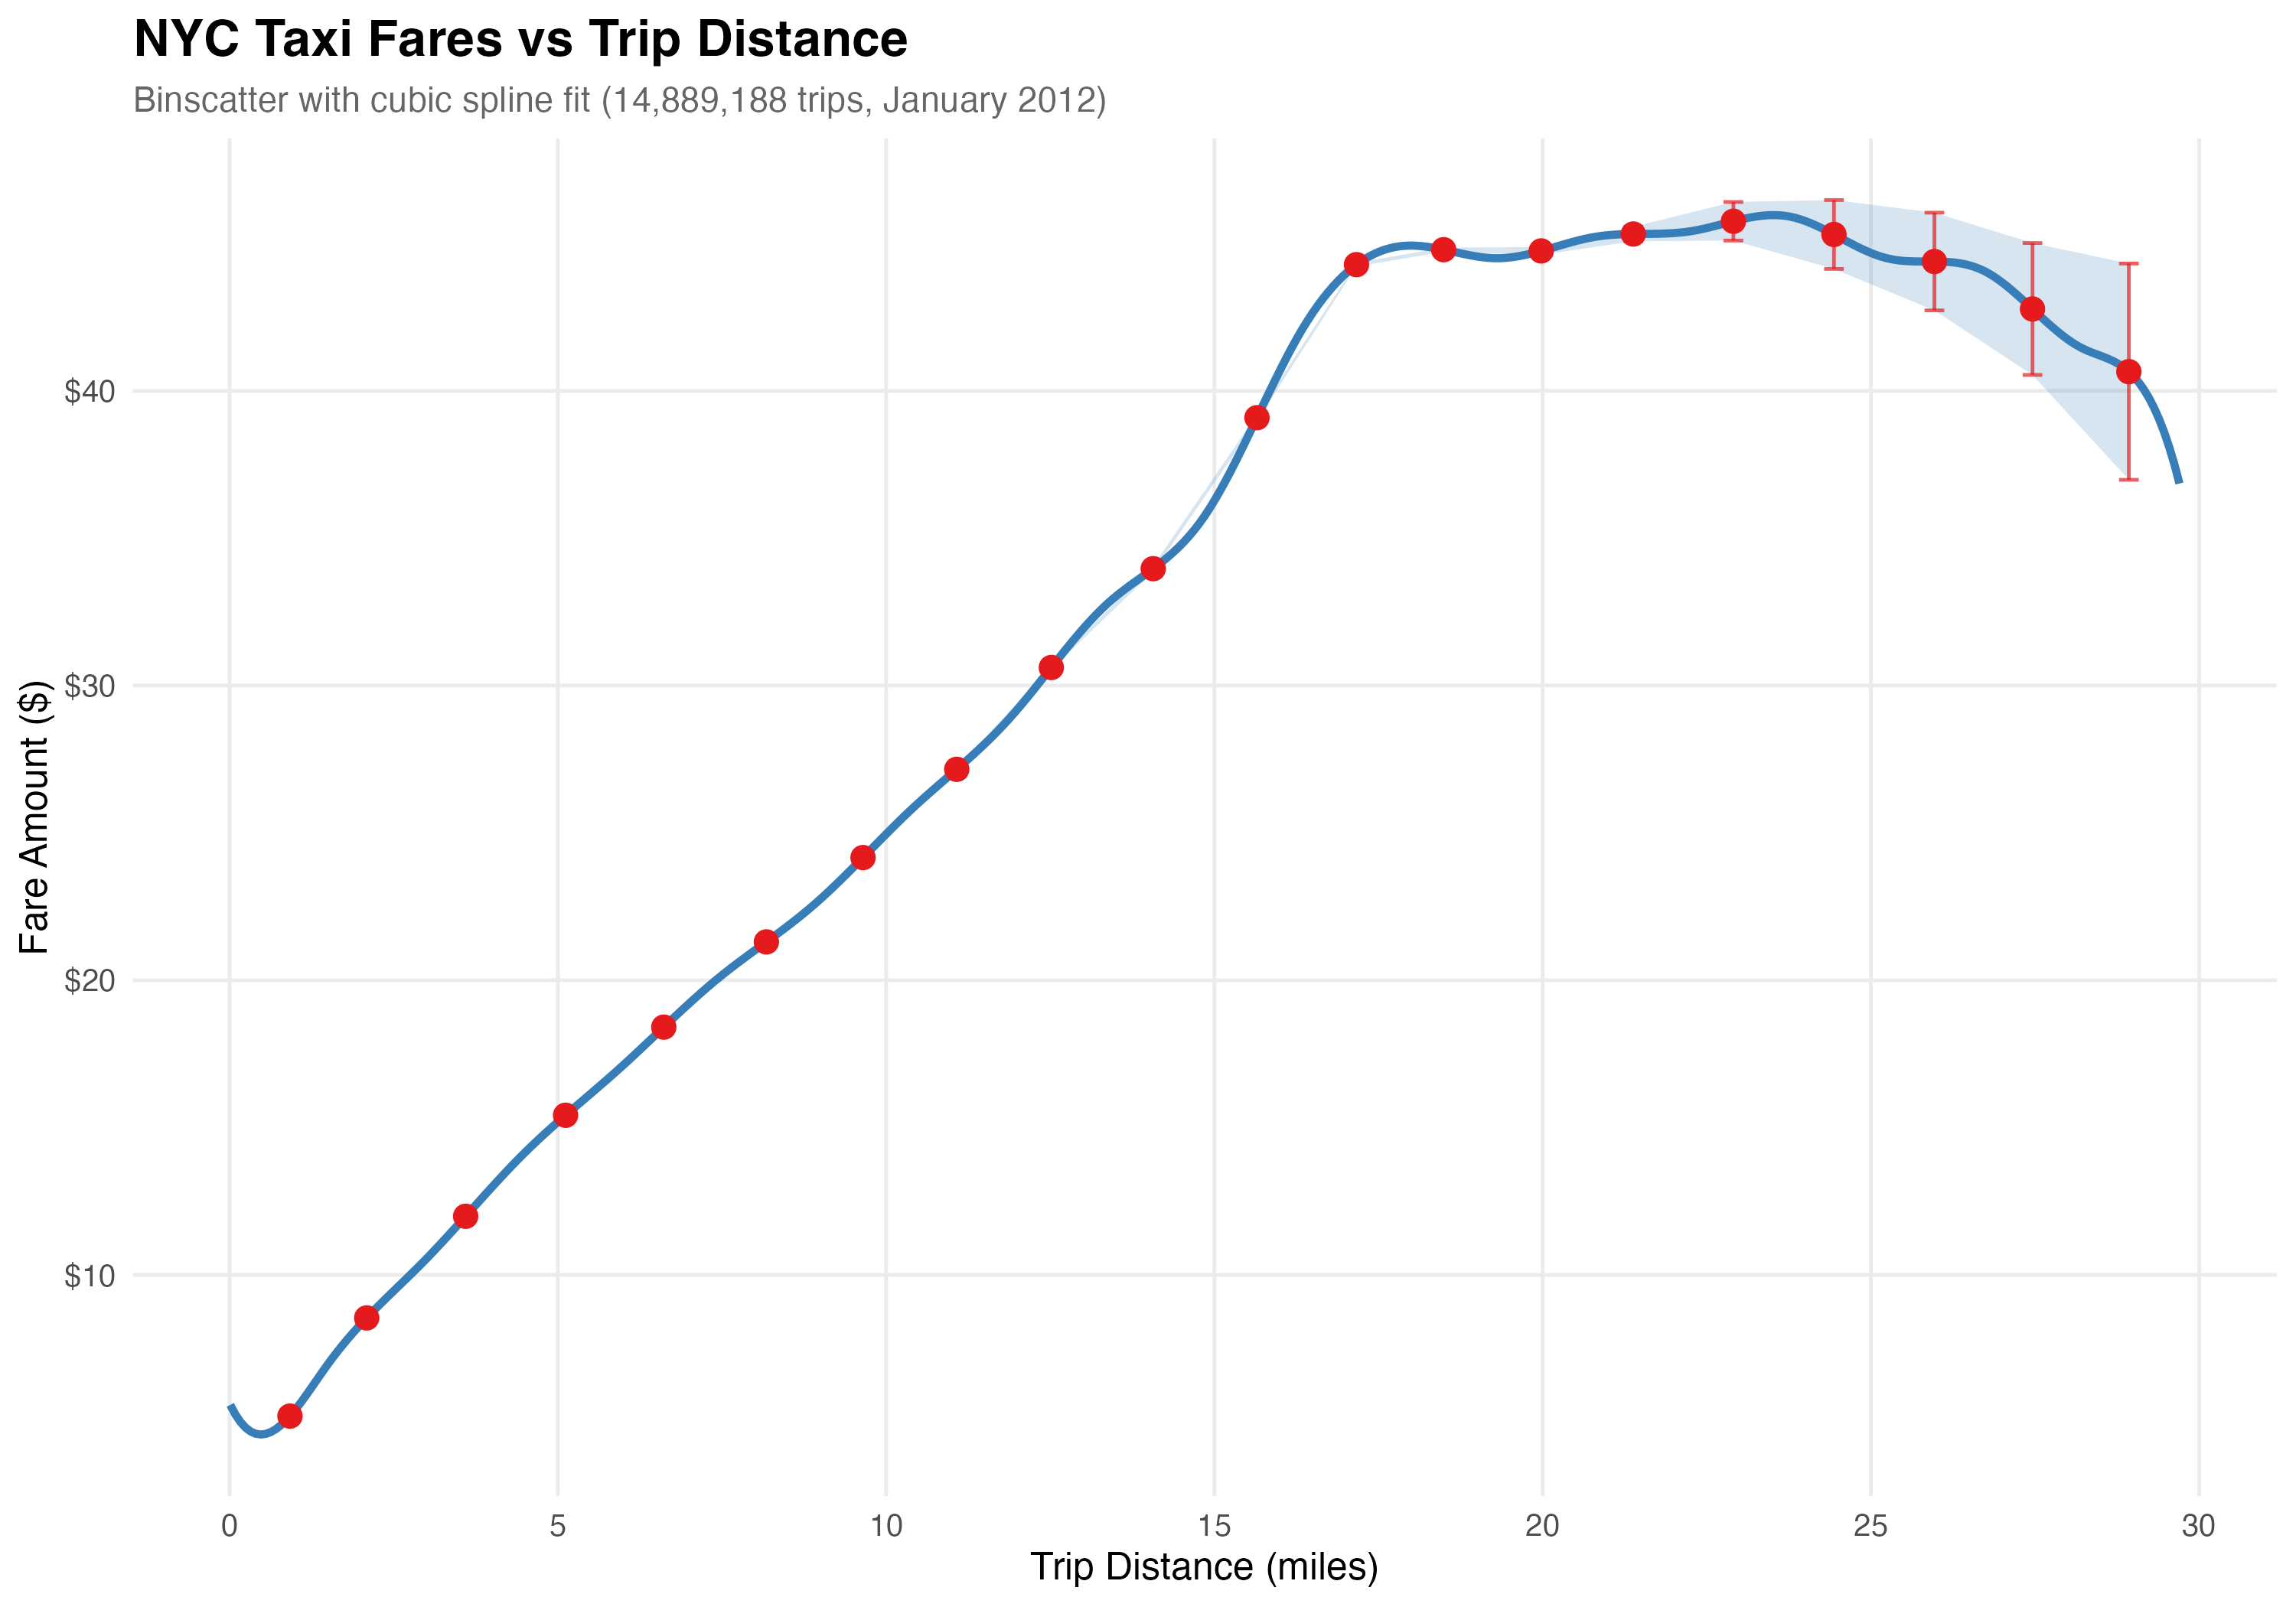
between bins. This produces plots like this, which shows conditional
means and CIs for the relationship between trip distance and fare amount
in the NYC taxi dataset (a large dataset with many millions of taxi
rides, which we use in our tests and examples). The CIs are
imperceptibly small for short trips, but on the right end you can see
the uncertainty grow as there are far fewer long trips.
Two exciting things about our implementation, quickly.
Accuracy
First, we can match the binsreg package pretty well. The
graph below shows a lot of the simplest specifications in binsreg on
some toy data; the fit and line numbers in the
graph titles are the differences between binsreg and
dbbinsreg estimates, and the numbers c(p,s)
are what control the degree (p) and smoothness
(s) of the approximating polynomials. So, for example, the
top right graph (c(3,2)) is a cubic polynomial with
continuous first and second derivatives at the bin edges. 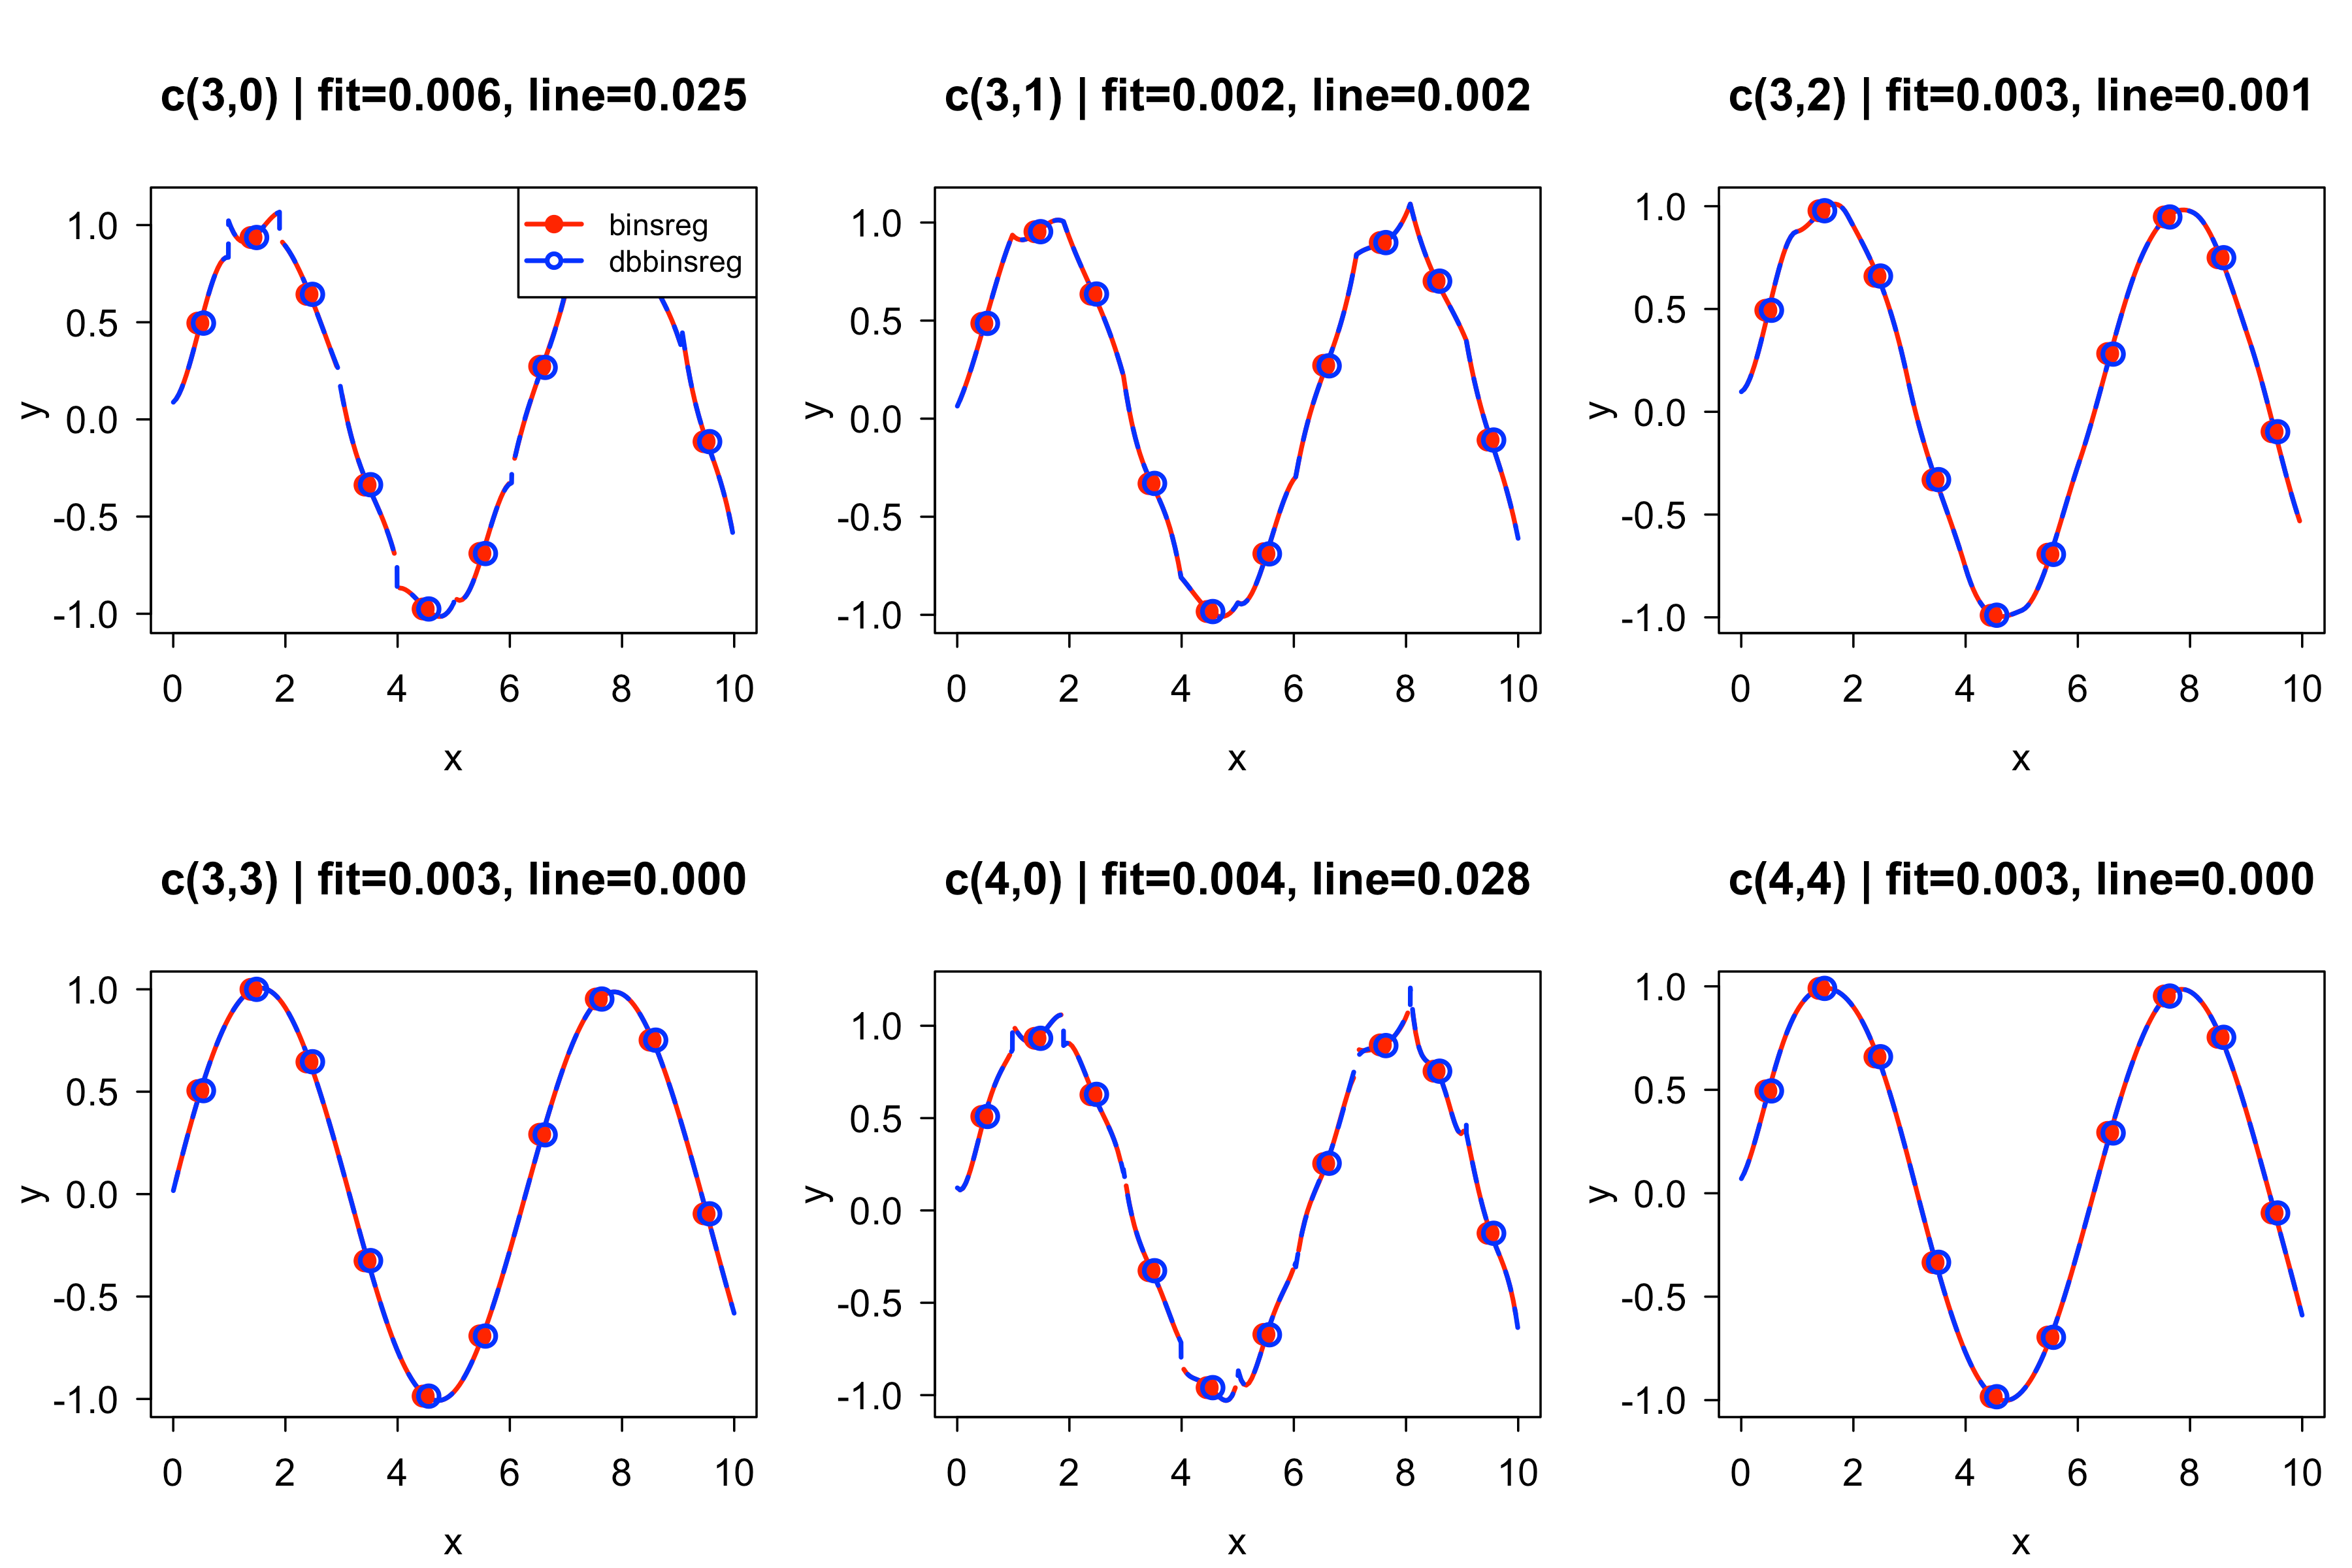
Note: So far, I think the only gaps between our packages’ results here come from minor differences between algorithms for calculating quantiles (we’re a little more limited due to writing the logic in SQL).
Speed
Second, our speed is pretty good too! On small datasets with 4,000
rows, we are faster than binsreg here (though don’t take this too
seriously, this test is far from extensive). We have a few different
algorithms under the hood, which causes some but not all of that
variation. 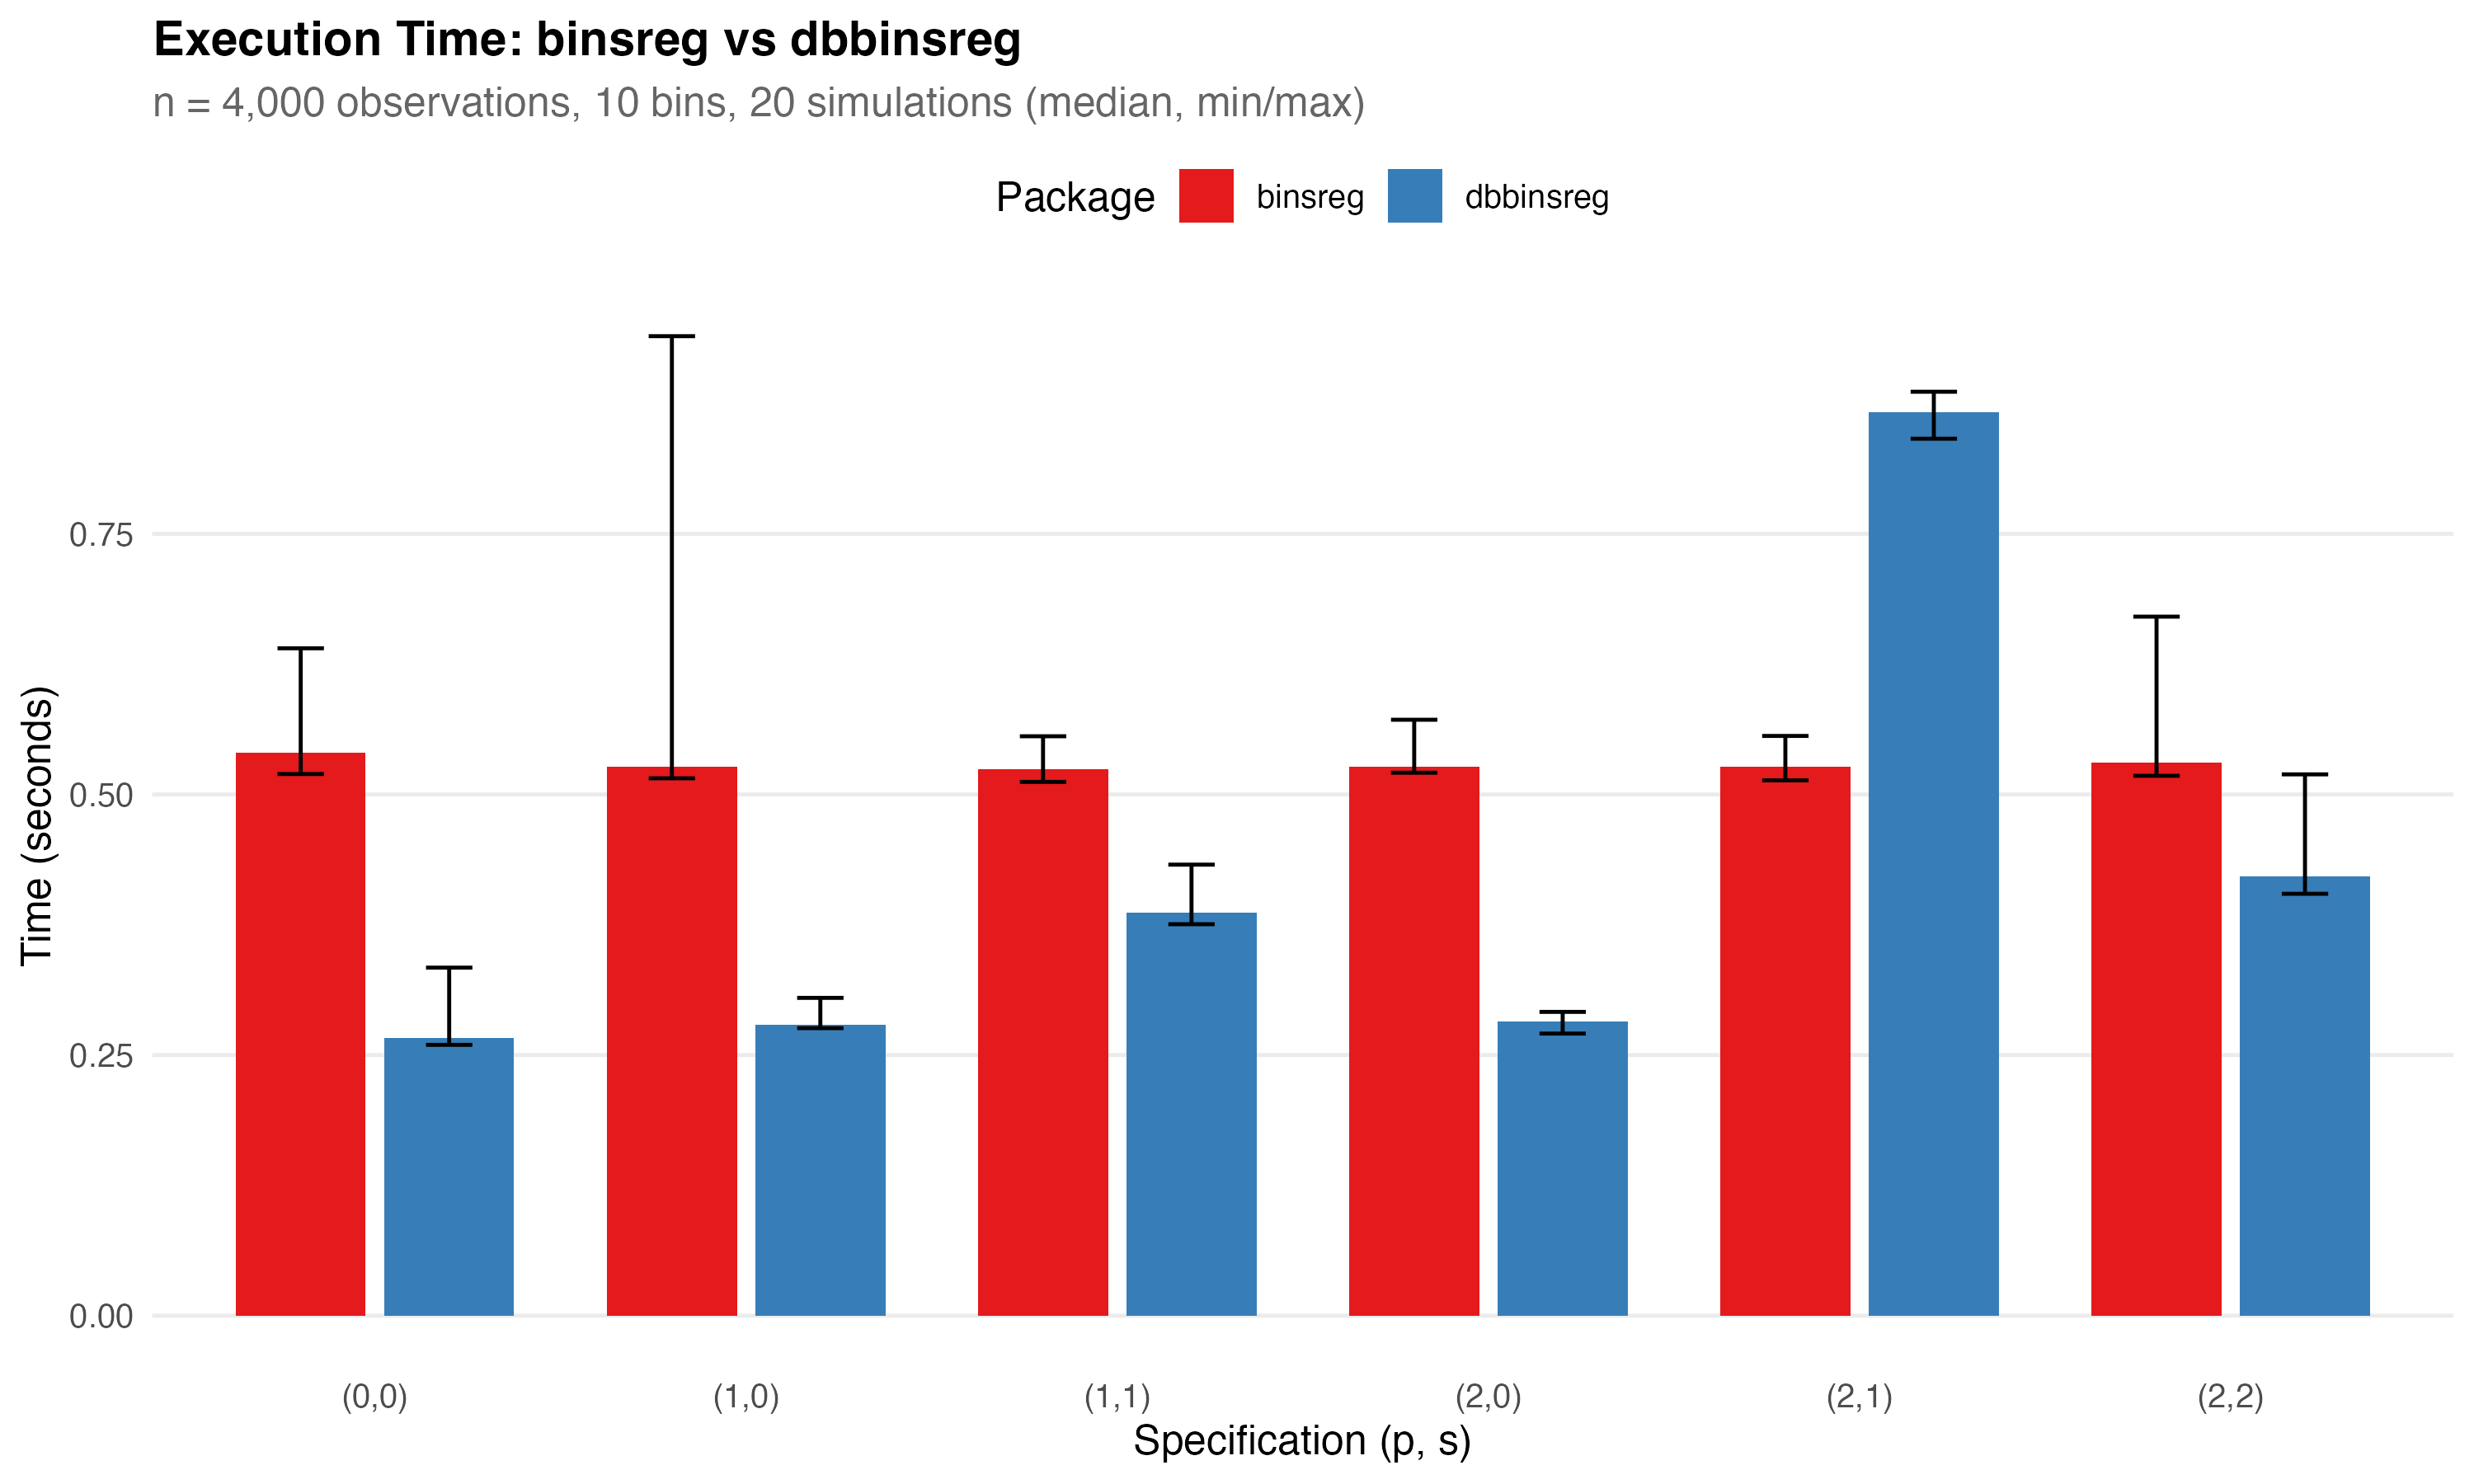 On slightly (100x) larger
data, things still look good, and times are only about double the times
on the small dataset
On slightly (100x) larger
data, things still look good, and times are only about double the times
on the small dataset 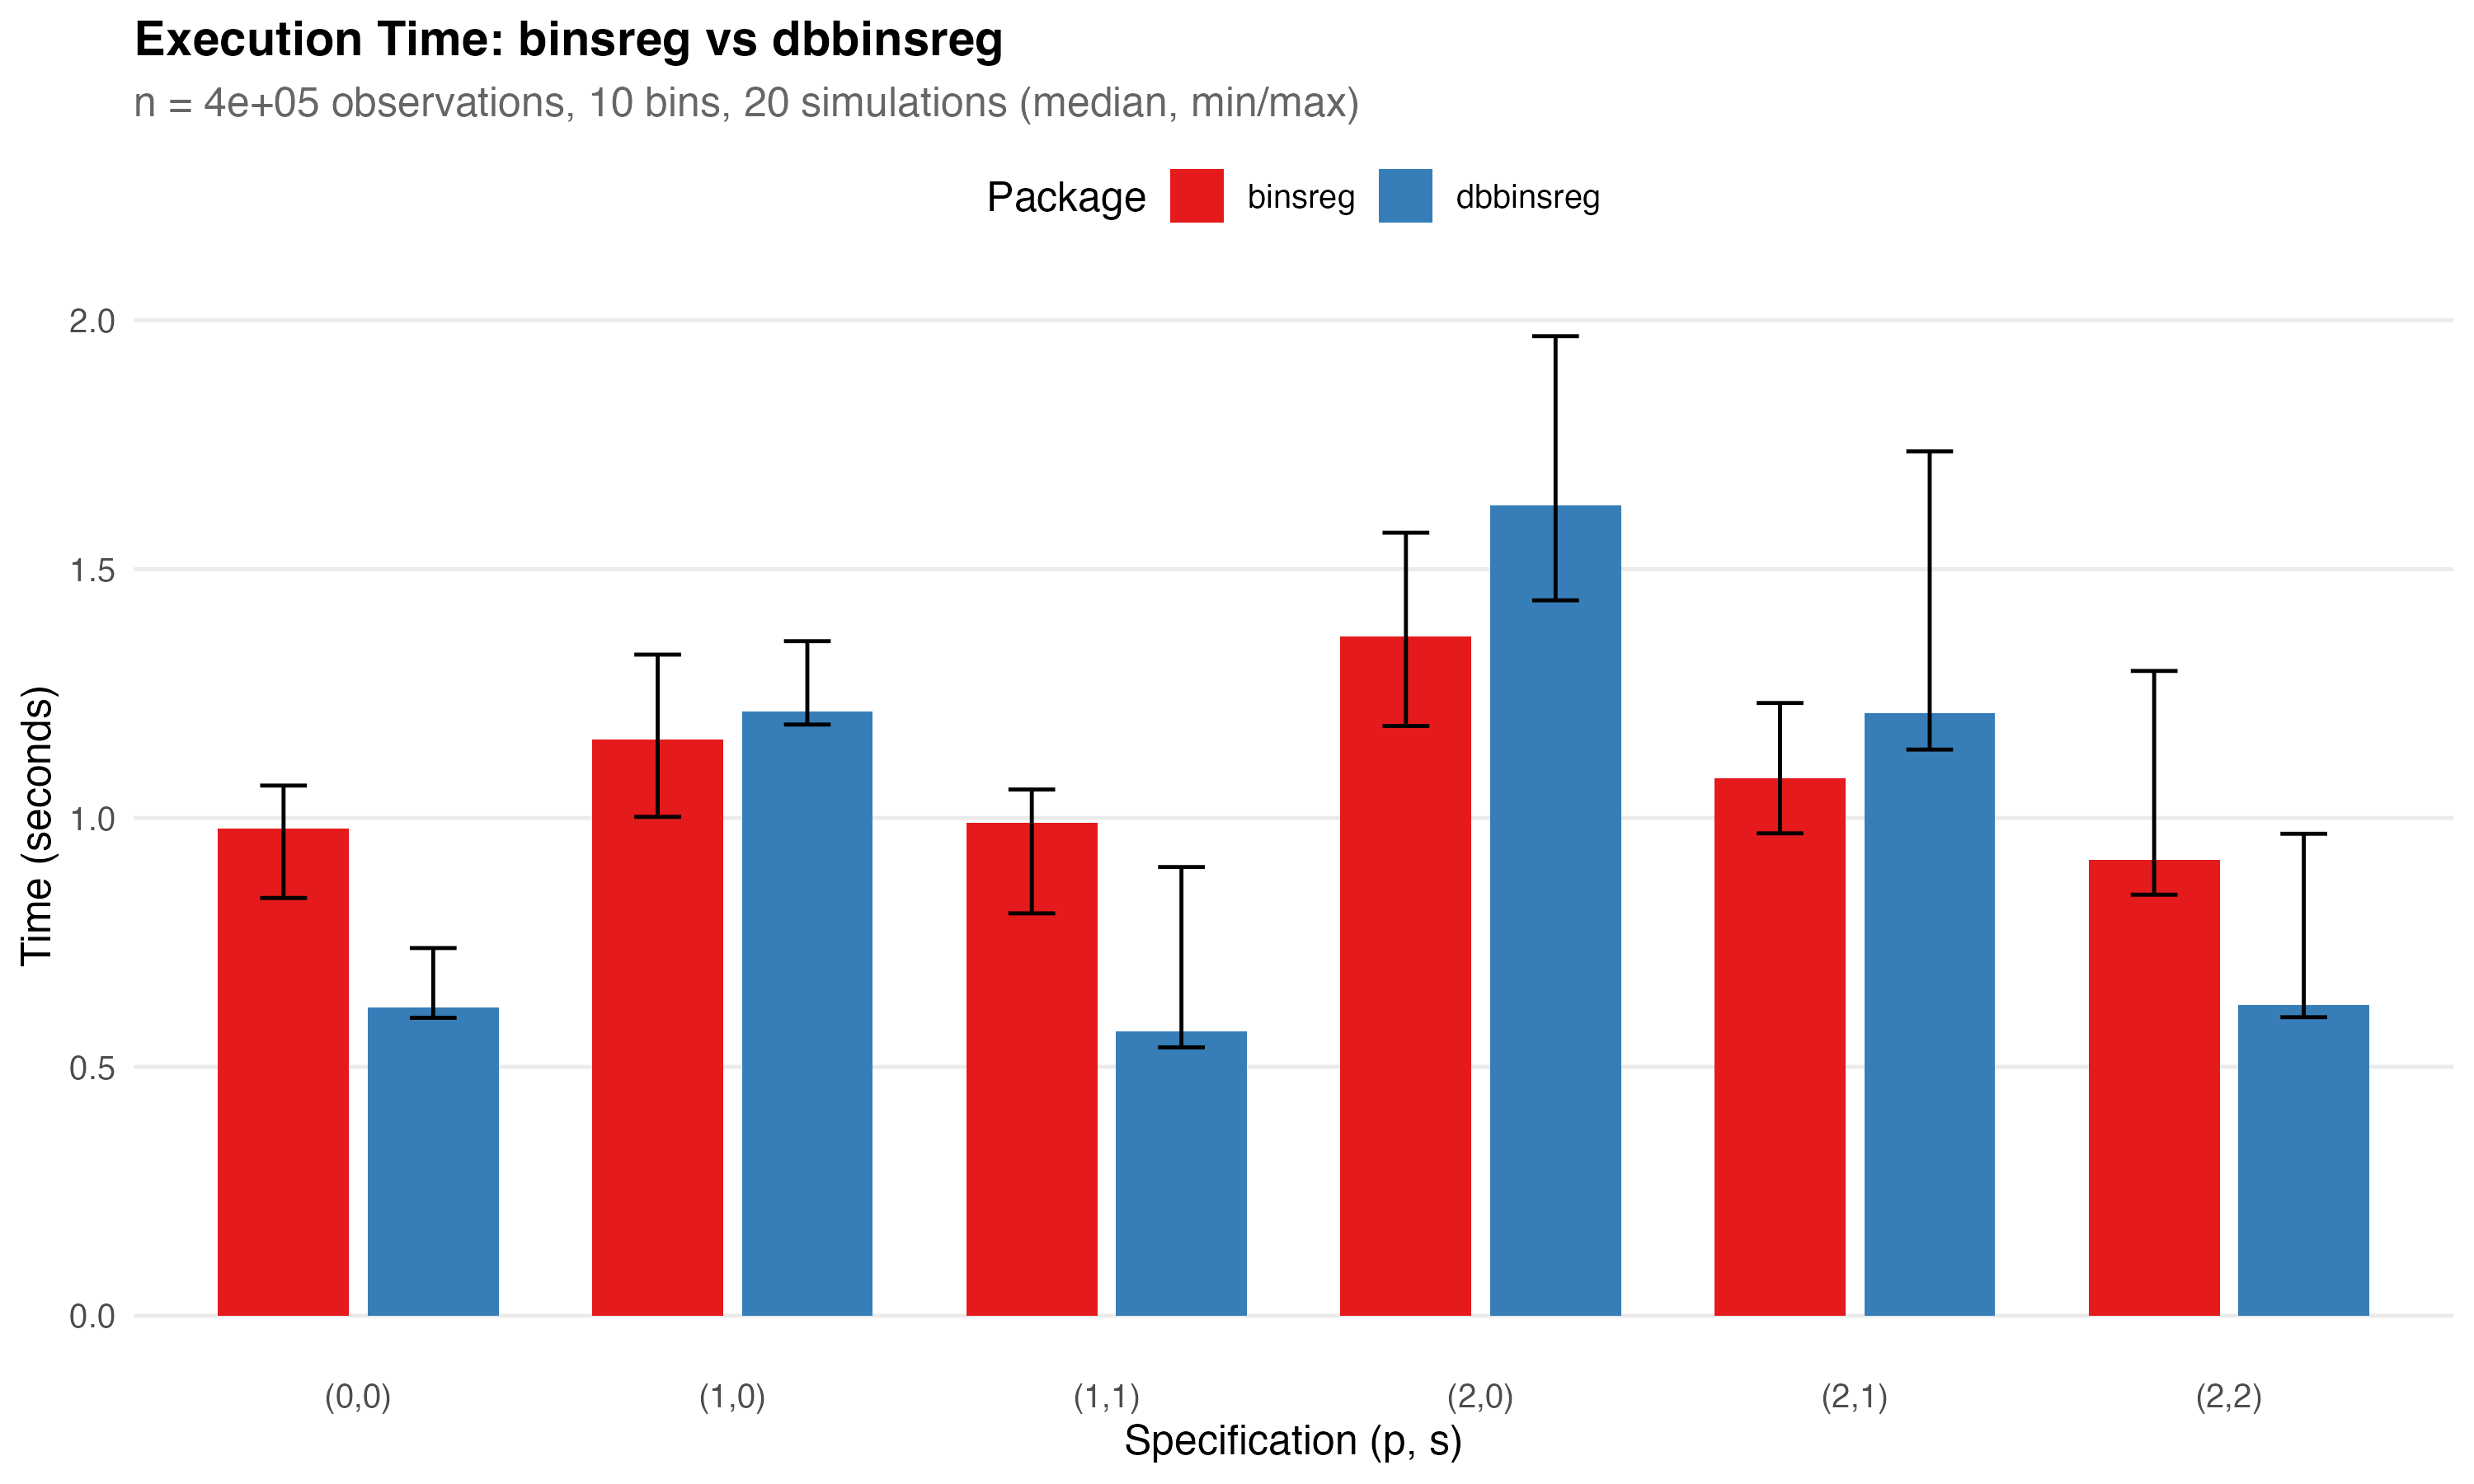 Admittedly, our times are
a lot more variable (across speciications) than binsreg, but we stay in
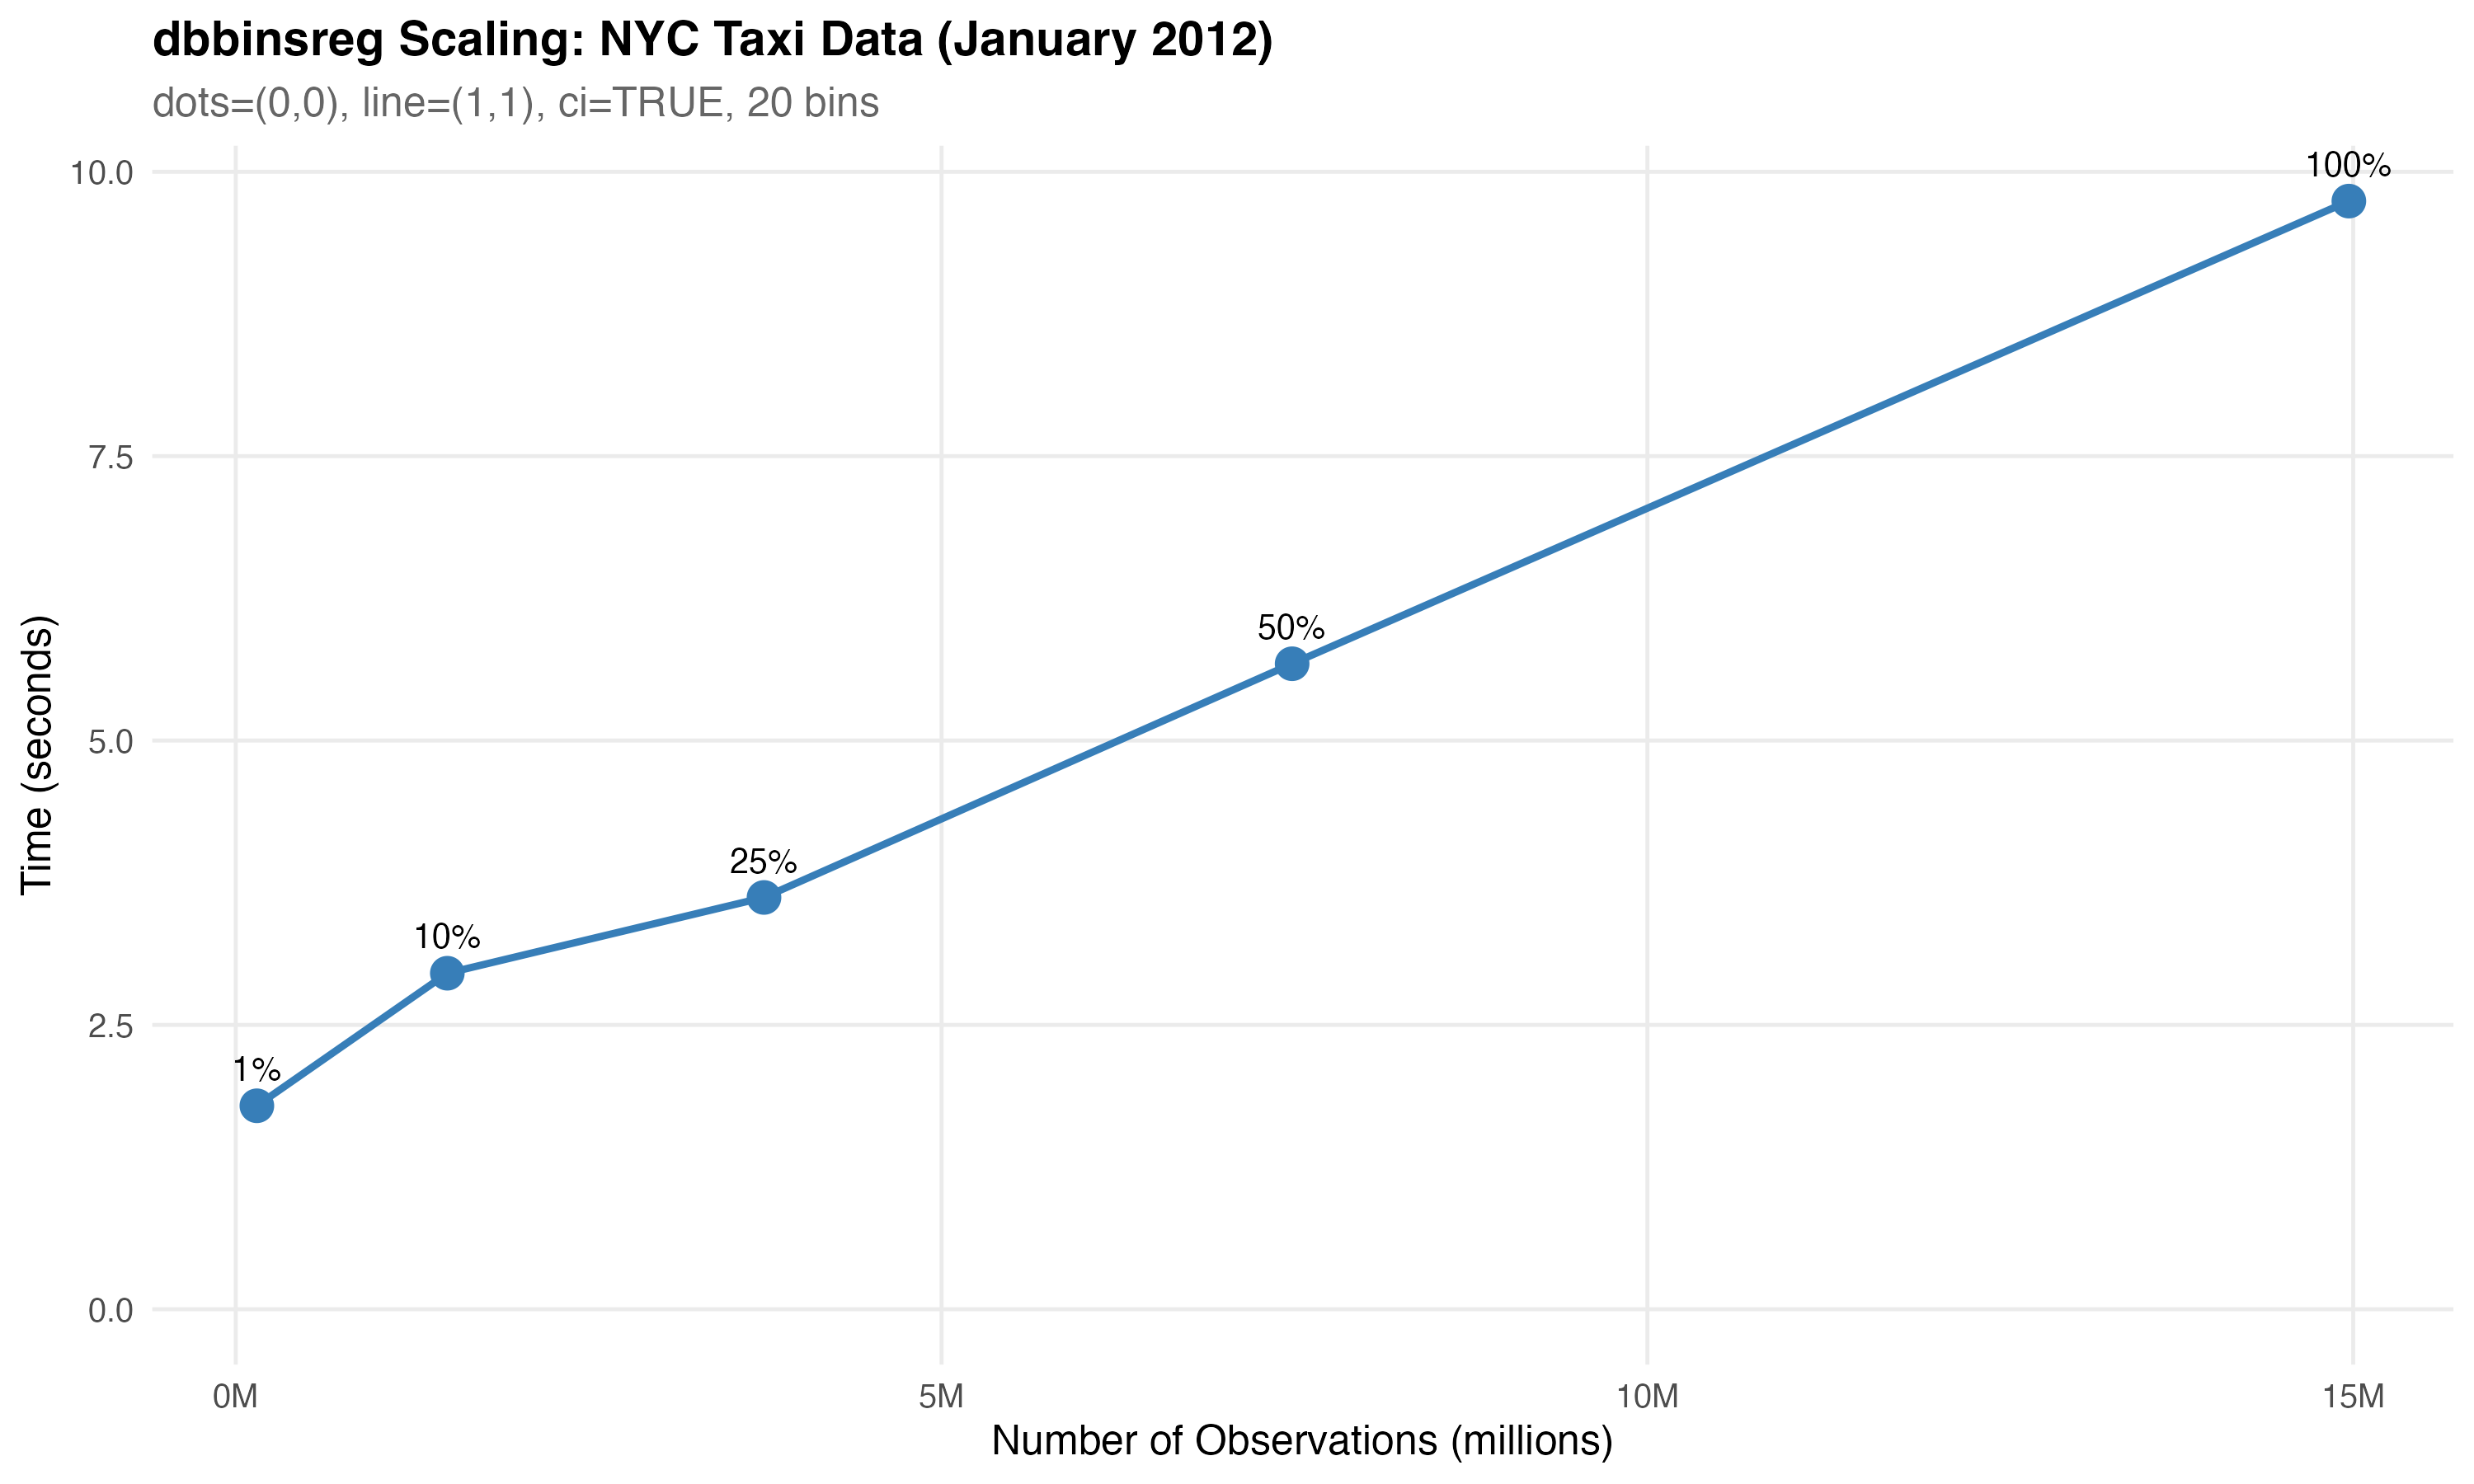
the same ballpark most of the time and are sometimes faster. Finally, on
the NYC taxi dataset (a large dataset used in our tests and docs,
subsetted to January here), we can see that further scaling continues to
look totally reasonable. About 15 seconds to handle 15M rows!
Admittedly, our times are
a lot more variable (across speciications) than binsreg, but we stay in
the same ballpark most of the time and are sometimes faster. Finally, on
the NYC taxi dataset (a large dataset used in our tests and docs,
subsetted to January here), we can see that further scaling continues to
look totally reasonable. About 15 seconds to handle 15M rows!
That all said, this package is very much in its early days and there are likely bugs still hiding around corners we haven’t tested yet! We welcome any feedback/issues on the GitHub repo.